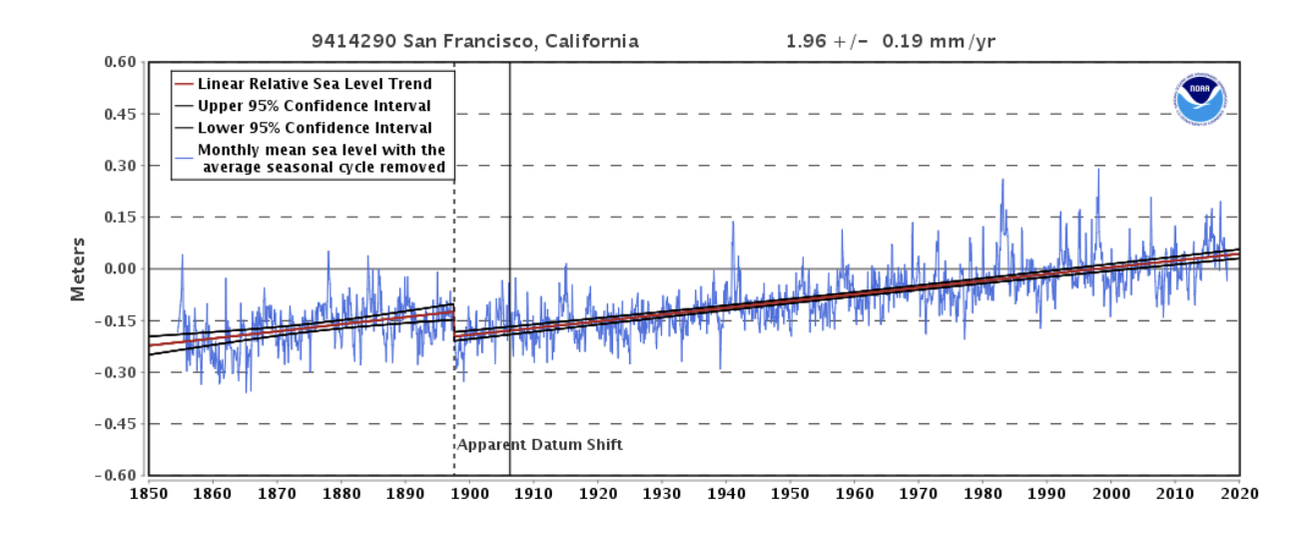
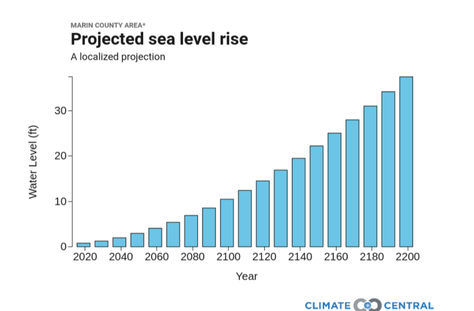
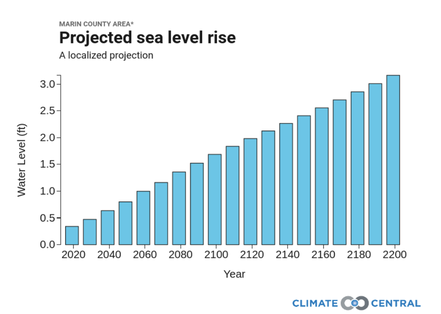
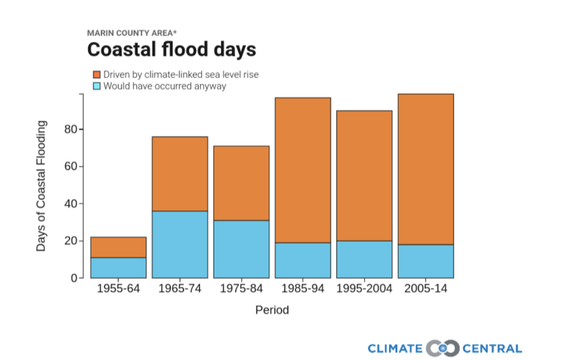
Climate changes and the local environment:Over the past century, Marin County has experienced eight inches of sea level rise, and by 2100 could ultimately see an increase of 16.6 to 65.8 inches. Global sea level rise, prompted by increased concentrations of atmospheric greenhouse gases such as carbon dioxide, can be attributed to two main factors: Arctic ice caps are melting, and oceans are warming thus expanding in volume. The most extreme emission scenario, which represents the worst possible future scenario, projects a 4ºC increase in temperatures and a global sea level rise of 8.9 meters. If current global emissions are restricted and warming is limited to 1.5ºC, global sea levels are still projected to rise by 2.9 meters. Marin County’s location on the coast of California makes it highly susceptible to the impacts of global sea level rise. The projected increase in sea levels will threaten beaches and wetlands, introduce salt water to inland areas, and displace native coastal organisms. In Marin County, 13,774 acres of land have already been declared vulnerable to the threats of sea level rise. Rising sea levels will increase the frequency and intensity of flooding, and the damages will be worsened due to large coastal storms. These storms will also become more severe, as the warming atmosphere is capable of holding more moisture. California is especially prone to infrequent, intense rain events, and often receives the majority of its annual precipitation in only one or two large storms. Sea level rise, combined with more intense storms and floods, will fundamentally alter Marin County’s environment by accelerating erosion, introducing saltwater to inland environments, and drastically altering coastal species’ habitats. In some cases, rising tides will make a portion of the County disappear completely. How we know:These projections and reconstructions are based on freely accessible online tools from The National Oceanic and Atmospheric Administration (NOAA) Tides and Currents tool and the Climate Central Surging Seas: Risk Finder projections and tools. The NOAA Tides and Currents resource reports local mean sea level changes from 1850 to today. It uses data collected from U.S. and global water level stations to reconstruct local sea level trends. The Climate Central Surging Seas tool generates sea level projections based on the different emissions scenarios presented in the NOAA Technical Reports. This tool uses data from the San Francisco water level station to generate the coastal flood days graph. Human consequences:Rising sea levels and worsening floods will pose health threats to the residents of Marin County and may require citizens to relocate. Furthermore, it is likely these factors will compromise the County’s water quality. Occasionally, increased flooding could improve water quality due to water percolation through the soil; however, prolonged flooding more often stresses or over floods the soil, ultimately degrading water quality. With more frequent floods, salt water, excess nutrients from fertilizers, and sediment from erosion are expected to enter the groundwater in Marin County. In addition, the current storm water drainage will not be suited to handle more severe storms, causing flooding in the streets. This will also threaten human health, as it increases the risk that sewage systems will overflow and contaminate groundwater. Rising sea levels will also affect the properties in Marin County that are currently on the coast. In a lower emissions scenario projecting three feet of sea level rise, $4.2 billion worth of properties will be compromised. In an extreme emission scenario that forecasts 10 feet of sea level rise, property damages will reach nearly $9.3 billion. In 2016, the Public Policy Institute of California reported that one in five Californians lives in flood-prone areas. The costs to replace this vulnerable infrastructure could exceed $575 billion, as an increasing number of buildings will be in high-risk zones. As the effects of sea level rise and severe floods worsen in Marin County, residents and the local government must take steps to reduce current damages and to minimize future impacts. In response to increased flooding, Marin County has already widened creeks to reduce erosion, support higher water levels during floods, and restore wetlands. To combat sea level rise, Marin County has implemented structural defenses, such as floodwalls, levees, and tidal gates. Additionally, as the County recognizes that many future impacts cannot be mitigated, it promotes adaptive measures such as building elevated structures, relocation of at risk infrastructure, and planned retreats. The County’s website also includes an extensive action plan detailing flood prevention procedures and emergency protocols. As the impacts of severe floods and rising sea levels intensify, Marin County must continue to promote methods to mitigate and adapt to these changes. Further reading:California's Water. Public Policy Institute of California Flood Protection. Marin Watersheds Sea Level Rise. Marin Watersheds Article author: Esther Doerr, Georgetown University
Article editor: Maddie Bowen, Georgetown University
2 Comments
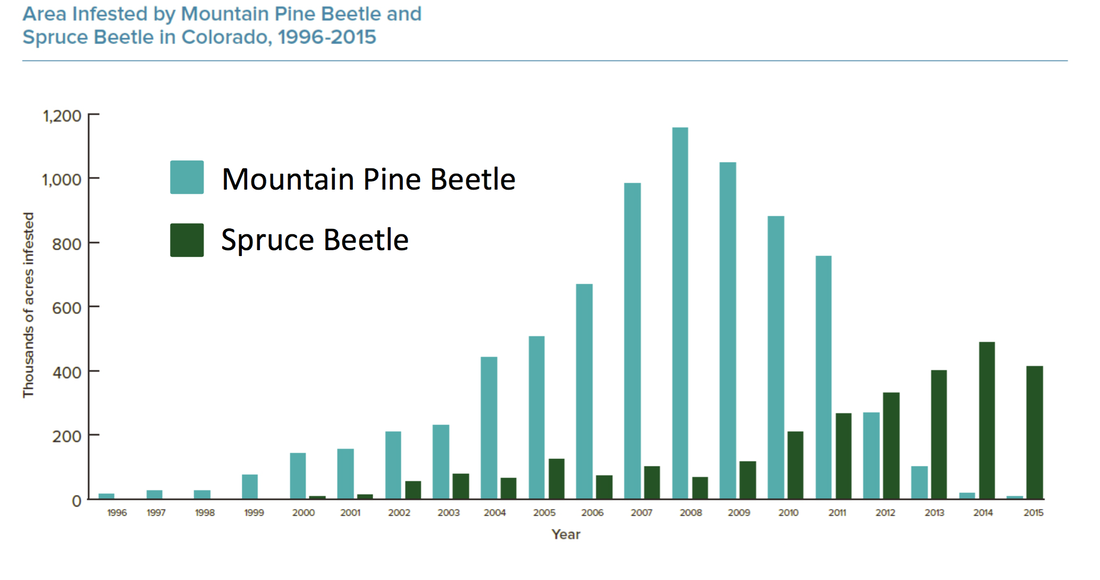
Climate changes and the local environment:Average annual temperatures in heavily-forested Larimer County have steadily increased since the 1970s. Since the rate at which water evaporates rises as temperatures warm, drought has grown more common in the county. Drought places pine trees in the county under stress, leaving them vulnerable to infestation by mountain pine beetles. Cold winter temperatures can kill these beetles and their larvae, especially if temperatures fall quickly in autumn. Yet rising winter temperatures have permitted huge numbers of beetles to survive into each spring. Meanwhile, by suppressing forest fires, foresters in Larimer County have made forests unnaturally dense with mature trees. Since mountain pine beetles prefer big trees with thick bark, these older trees are especially vulnerable to infestation. 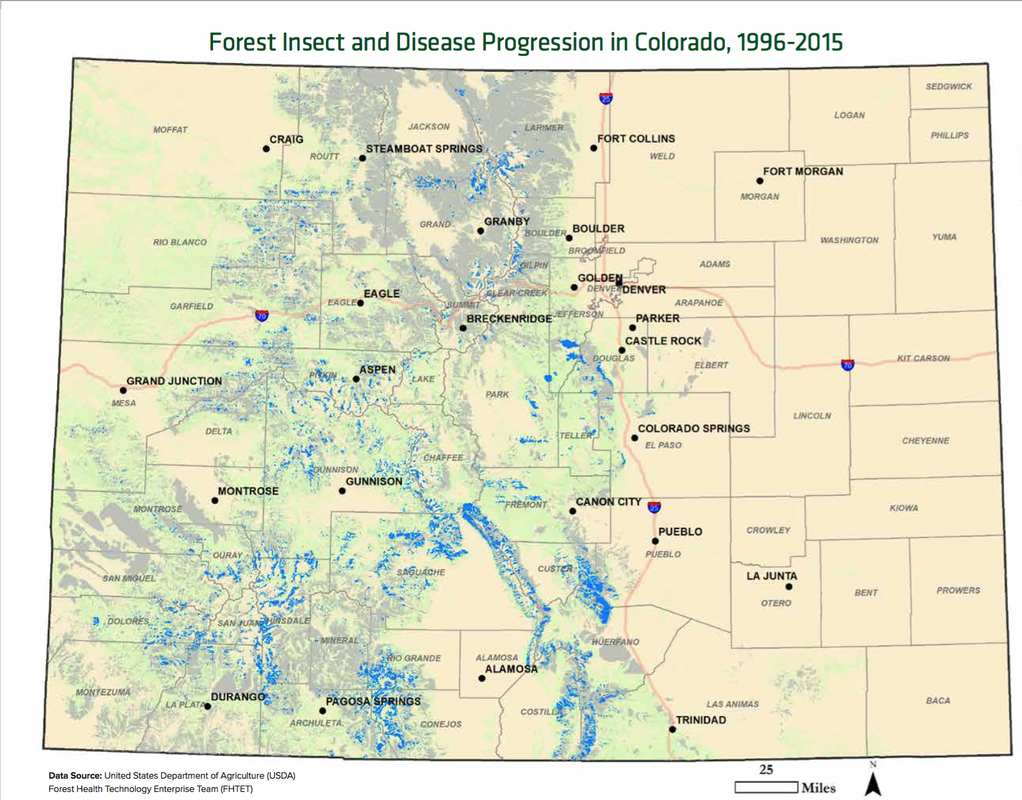 Map showing the amount of forests in Colorado that have been affected by diseases or insects from 1996-2015. The grey shading indicates forests that were affected from 1996-2014, and the blue color indicates forests that were newly affected in 2015. This map was produced from aerial data and provided by the United States Department of Agriculture. Source: Colorado State Forest Service. An attack begins with a single female beetle. The beetle burrows into the bark of a pine tree and releases a pheromone signal. The signal summons more beetles, which gather and attack the tree. Once the tree has been compromised, meaning that the flow of nutrients through the trunk has been impeded, the beetles deposit their larvae and continue onward, attacking nearby mature trees. While trees have numerous natural defenses to these beetles, the stress imposed on them by warming temperatures compromises their ability to use those defenses. To make matters worse, the mountain pine beetle has evolved to be able to ingest toxic resin that acts as one of the tree’s natural defenses. There is a cyclical character to mountain pine beetle infestations. As mature trees die and their population declines, so do numbers of mountain pine beetles. Yet rising temperatures and increasing drought have nevertheless expanded the beetle's range and overall population size. Since dead trees release carbon dioxide as they decay, mountain pine beetles are turning the forests of Larimer County and the western United States into a source of greenhouse gases that contribute to global warming. They are therefore worsening the climatic trends that have contributed to their booming numbers. How we know:This information is based on reliable, easy to use tools provided by the National Oceanic and Atmospheric Administration (NOAA) State Annual and Seasonal Time Series and the NOAA Climate at a Glance app. Both tools use data collected at weather stations and stored in NOAA's U.S. Climate Divisions database. This article also draws on data from a 2015 aerial survey administered by the Colorado State Forest Service. Human consequences:Colorado forests purify the air and water; generate reliable sources of wood products; and provide opportunities for lucrative outdoor recreation activities. Some 90% of Colorado's inhabitants engage in outdoor recreation per year, and everyone benefits from the crucial economic and environmental resources generated by the state's forests. As of 2017, the state has a $17.3 billion tourism industry that relies on the aesthetic beauty of forested landscapes to attract visitors. Colorado is therefore a state that depends on the health of its forests. Thus, a threat to Colorado’s environment is a threat to its social and economic wellbeing. Perhaps the most profound consequence of the mountain pine beetle epidemic for the people of Larimer Country involves the relationship between warming, beetle infestations, and wildfires. Dry, dying trees are much more vulnerable to wildfires, and length of the annual wildfire season in Colorado has therefore increased by more than two months since 1970. In their immediate vicinity, wildfires threaten human property, livelihoods, and safety. Even at range, wildfire smoke can threaten human health, as inhalation can compromise respiratory function. Wildfires and declining overall forest health also reduce the quality of available water in Larimer County, and across Colorado. Forests naturally filter precipitation, maintaining clear waterways, but wildfires threaten water quality by introducing toxins into streams and watersheds. Since decaying trees release nitrates, mountain pine beetle infestations also increase the concentration of dangerous nitrates in the water supply. Larimer County officials are therefore carefully monitoring water quality in their county. Their efforts - and those of officials across Colorado - have broad significance. Nineteen states obtain their water supply from river systems originating in Colorado. Warming will impact not only the supply, but also the safety, of the water they acquire. Further reading:Pine Beetle Epidemic. National Geographic 2015 Report on the Health of Colorado’s Forests. Colorado State Forest Service 2012 Report on the Health of Colorado’s Forests. Colorado State Forest Service Climate Change and Ecosystem Disruption. Am J Public Health Mountain Pine Beetle & Cold Temperatures. Government of Alberta Clean Air, Water and Soil. Larimer County Website Article author: Esther Doerr, Georgetown University
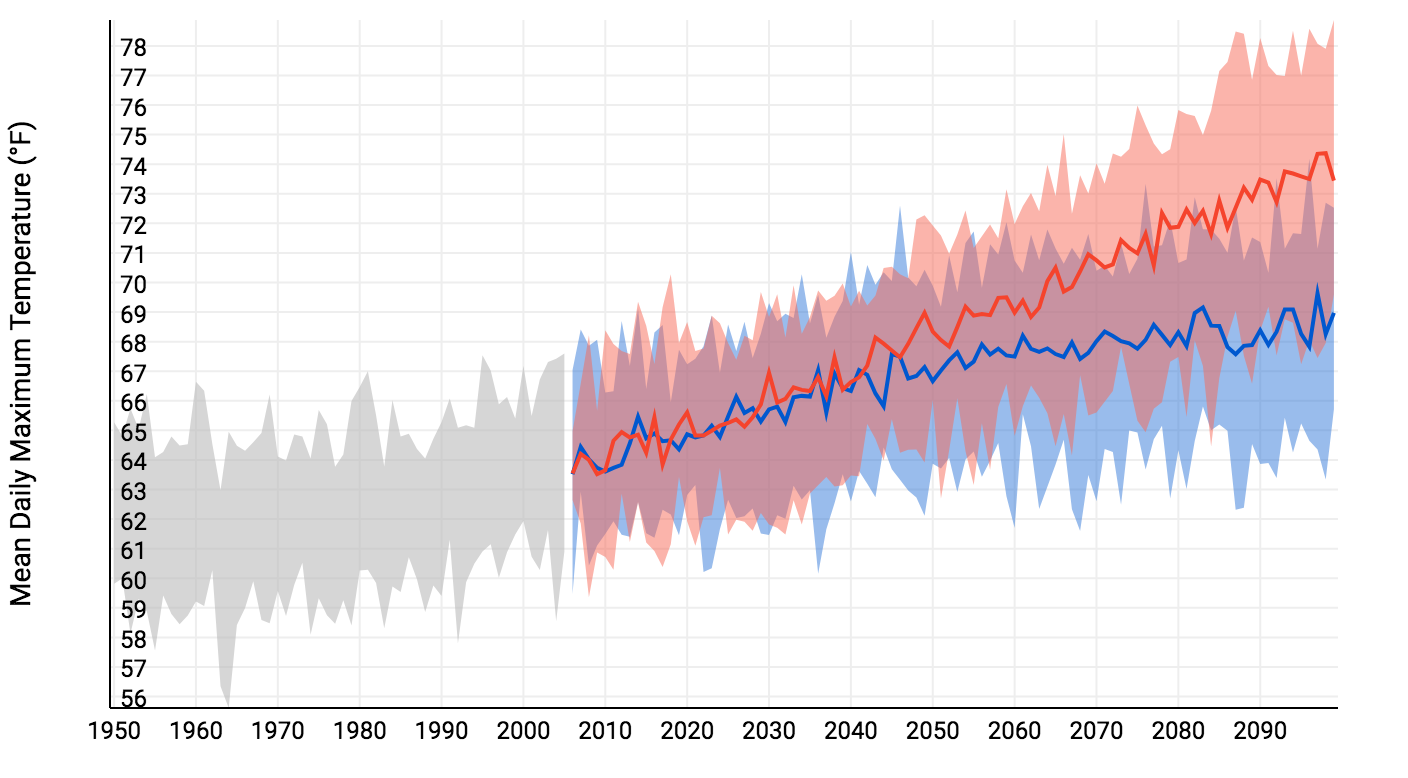
Article editors: Dr. Dagomar Degroot, Georgetown University; Sarah Harper, Georgetown University FUTURE: rising temperatures, increased precipitation, and hardier crops in Marion County, Indiana4/30/2018 Climate changes and the local environment:As the amount of carbon dioxide in the atmosphere continues to increase due to human emissions, average annual temperatures in Marion County, Indiana are expected to rise from an annual average of about 63.5°F in 2007 to an average of 69°F by 2100 under “low emission” predictions, or an average of 73.5°F under “high emission” predictions. Low emission conditions are estimated by assuming that we will at least moderately decrease our emissions in the near future, while high emission conditions assume that we will do nothing to change our current behavior. Without immediate action to reduce emissions, we can expect to have almost twenty times as many extreme heat days in Marion County. Extreme heat days are days when the highest temperatures rise above 95°F. Likewise, Marion County is expected to experience three to four times as many high heat nights, defined by temperatures 68°F or above, in the coming century under low and high emission scenarios respectively. Another consequence of climate change that Marion County will face in the coming years is a likely increase in rainfall. Average annual precipitation has been increasing since 1895 in Indiana, and is expected to continue to increase in the future, possibly by 6-8% within the next half century. Most of this rain is expected in the winter and spring, leaving the summer and fall months possibly drier than they are now. With increased precipitation, we also expect to see heavy downpours more often followed by more frequent flooding. How we know:The projections of future climate change presented in this article come mainly from the Indiana Climate Change Impacts Assessment compiled by Purdue University and the National Oceanic and Atmospheric Administration’s (NOAA) Climate Explorer tool. Both of these tools rely on temperature and precipitation data gathered at weather stations on the ground around the county and state. These historical values are then compared to predictions for the future compiled by the United Nations’ Intergovernmental Panel on Climate Change (IPCC). The IPCC creates future predictions with advanced computer models that evaluate the climate under different emissions scenarios. Human consequences:Rising temperature and changes in rain patterns will likely have serious consequences for the health of people in Marion County. Scientists expect higher rates of dehydration, heat stroke, and death. Extreme heat can worsen pre-existing conditions, such as heart disease and diabetes, especially among children and the elderly. The number of deaths that can be linked to temperature extremes is expected to rise from 33 in 1990 to between 43 and 71 per year by 2050. As temperatures rise in Marion County, air quality may also decline. Ozone particles stay near the ground in hot weather, triggering asthma attacks and exacerbating high blood pressure. Since cold winters currently control populations of mosquitoes and ticks, warming trends could well promote a sharp increase in the number of both pests, which could in turn allow the disease they carry to infect more people. It is likely that the emissions cuts that would reduce global warming would save more lives in Indiana than in most other states. The growing season in Marion County has already lengthened significantly. By the 2050s, it is expected to lengthen by at least thirty days under high emission scenarios. The longer growing season will likely increase crop productivity in Marion County, though not as much as one might expect. The increasing number of high heat days will likely damage some crops, and the increase in precipitation during winter and spring, together with the rise in extreme precipitation events, should increasingly wash fertilizer and nutrients from the soil into nearby watersheds. Nevertheless, Indiana is likely to remain the top producer of corn and soybeans. Marion County will therefore growing increasingly uncomfortable and unhealthy for many of its residents, yet a key sector of its economy - agricultural production - may in fact benefit from at least modest warming. These benefits will likely decline sharply in high emissions scenarios, and it is therefore in the interest of Marion County residents to contribute to a lower-carbon future. Further reading:2014 EPA Clean Power Plan. EPA. Impacts of Climate Change for the State of Indiana. EPA. Indiana’s Past and Future Climate. Purdue University. Article author: Eve Kelly, Georgetown University
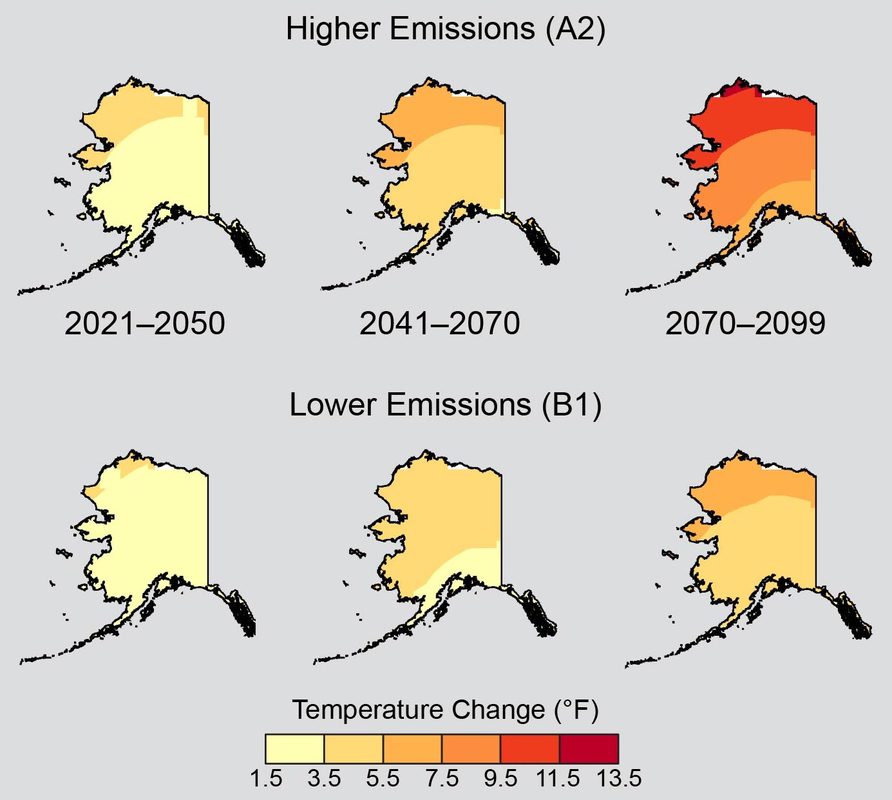
Article editor: Dr. Dagomar Degroot, Georgetown University Climate changes and the local environment: Alaska is warming more than twice as quickly as the contiguous United States. Over the past 60 years, average annual temperatures in Alaska have increased by about 3°F. Winter warming has been even more extreme, with average seasonal temperatures rising by 6°F. Climate projections based on continuing high greenhouse gas emissions - known as "high emissions scenarios" - predict that average winter temperatures in towns across North Slope Borough in northern Alaska will rise by as much as 25°F in the coming century. By 2050, average annual temperatures across Alaska are expected to increase by 2 to 4°F. As Alaska continues to warm, melting sea ice and coastal erosion represent the two most pressing threats to North Slope Borough. Permafrost is a thick layer of soil, usually a foot or so down from the surface, that remains frozen year-round. Permafrost covers over 80% of Alaska, but that number is shrinking as rising temperatures cause permafrost to melt. When permafrost melts, the ground above it collapses, and methane enters the atmosphere. Methane is a potent greenhouse gas, and although it does not stay in the atmosphere for long when compared to carbon dioxide, it can cause profound regional warming. Thus because melting permafrost also increases atmospheric methane, rising temperatures will provoke even more warming and melting. Increasing temperatures will also melt sea ice on the coasts of Alaska. Models that match historical trends predict that, by 2030, the entire Arctic could be ice-free in the summer. Loss of sea ice is dangerous for ecosystems in North Slope Borough. In the colder past, sea ice acted as a natural barrier to storms and waves. However, as the sea ice melts and recedes from the coastline, wind and water erosion is projected to increase accordingly, especially during big storms. Permafrost also once protected the North Slope Borough coasts from erosion, but it may not for much longer. How we know: These predictions are largely based on two easy-to-use tools that are freely accessible online: the National Aeronautics and Space Administration’s (NASA) GISS Surface Temperature Analysis and the National Snow and Ice Data Center’s Arctic Sea Ice News and Analysis (NSIDC). The GISS Surface Temperature Analysis tool uses maps to show global temperature anomalies, comparing current temperatures to temperatures in the 1951-1980 period. Mean temperatures are averaged over a specific time period and interval, and the analysis is updated monthly. Data is compiled from the National Oceanic and Atmospheric Administration’s databases and satellites. The Arctic Sea Ice News and Analysis tool provides updates and scientific analysis on the conditions of Arctic sea ice. The website publishes graphs and animated visuals documenting the extent, depth, and concentration of sea ice. The tool is run by National Snow and Ice Data Center scientists, along with support from NASA. Human consequences: Future climate change will likely have devastating consequences for North Slope Borough and its residents. The imminent reality of a seasonally ice-free Arctic may sound like a desirable outcome at first, seeing that some economic opportunities such as faster shipping routes, oil and gas exploration, and tourism may become available. However, coastal villages, which represent many of the residences in North Slope Borough, will face one of two unfortunate realities as erosion threatens homes. At best, residents will be forced to relocate inland, and at worst, homes and even lives will be lost to the sea. More than 30 villages in North Slope Borough have already been identified for relocation. Indigenous lives are especially threatened as climate change continues in the coming century. Alaskan Iñupiat make up fifty-two percent of all residents in North Slope Borough, according to a 2016 census. Many rely on a subsistence diet and are therefore relatively vulnerable to sudden changes in their surrounding ecosystems. Whales and seals, which are hunted out on the sea ice, constitute the majority of the protein in local Iñupiat diets. With the sea ice retreating, the accessible supplies of fish, game, and whales will decline, and Iñupiat hunters will have to brave dangerously thin ice in hopes of catching food. Thawing permafrost may also undermine human health and economic growth in North Slope Borough. These problems will include a loss of clean water, saltwater intrusion, and the expansion of diseases northward into the warming climate. Many villages, especially those of lower income, dig holes into the permafrost and use these to dispose of and contain sewage; however, as the permafrost thaws, the sewage will leak out, resulting in contamination and the spread of disease. Thawing permafrost will also contribute to increasing pollutant exposure to residents, as the soil contains a significant amount of mercury and carbon dioxide. Additionally, thawing permafrost is projected to add up to $6.1 billion in maintenance costs, as the uneven sinking of the ground will disrupt existing infrastructure. Unfortunately, many of these events will occur even if warming is slowed by curbing emissions. Combating these changes will require both adaptation and resilience in North Slope Borough and beyond. Further reading: Alaska Regional Climate Projections. Scenarios Network for Alaska Planning. Alaska. U.S. Global Change Research Program Article author: Georgia Brainard, Georgetown University
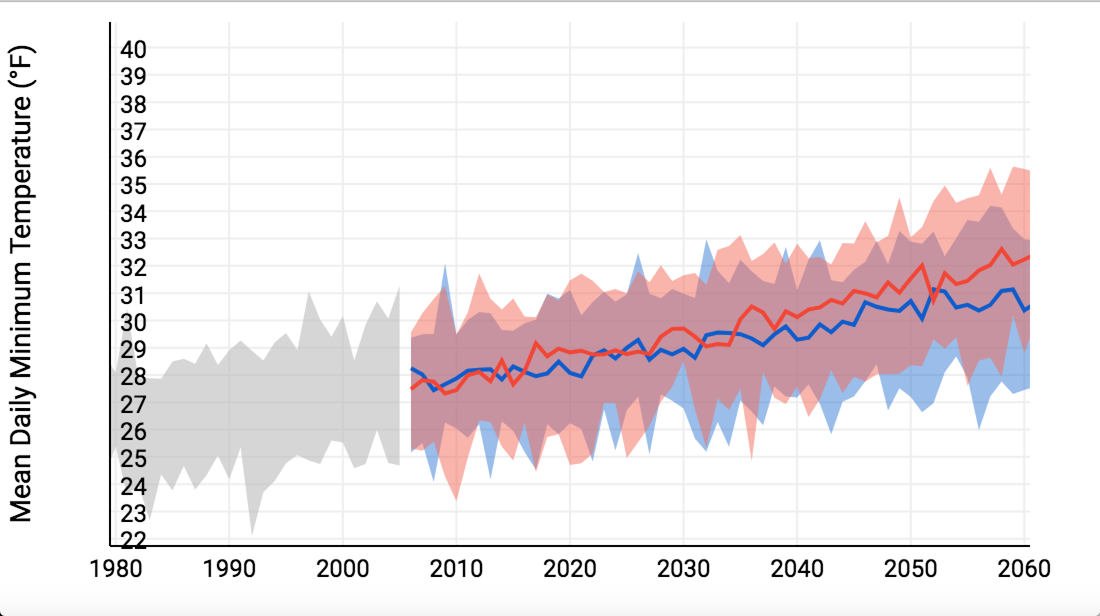
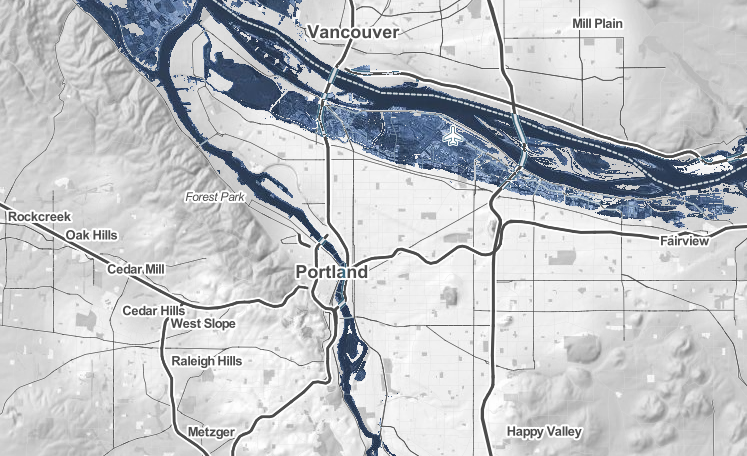
Article editor: Dr. Dagomar Degroot, Georgetown University Climate changes and the local environment: A 2013 report from the Intergovernmental Panel on Climate Change layed out the specific ways in which global warming has changed, and will continue to shape, the planet’s many environmental systems. For Multnomah County, this means increasing average temperatures throughout the year, greater incidence of extreme heat days, and increased risk of flooding. Multnomah County, home to the city of Portland, rests on the bank of the Willamette River. Even with conservative estimates of climate change and a global increase of only 1 degree Celsius, Portland would experience significant flooding of up to seven feet. With a global temperature increase of 2 degrees Celsius, the Limit set by The Paris Agreement on Climate, Portland would see fifteen feet of flooding. Multnomah’s average temperatures are also predicted to increase, and have been increasing notably since the mid 1950s according to the chart from the National Oceanic and Atmospheric Alliance, and is predicted to rise at increasing rates for the next century. Even in the “low emissions” scenario, average temperature in Multnomah County is predicted to increase by about 4 degrees Farenheit in the next century, or up to 9 degrees Farenheit in the high emissions scenario. While Oregon as a whole has a highly variable climate, Multnomah county is a fairly consistent climate zone, ranging from a 40° F average in January to a 68° average in July. However, extreme heat days are predicted to quadruple in frequency from about ten a year in 2000 to 40 a year by 2050. This will have major sociological and economic implications for the county. How we know: These projections primarily rely on two tools that are freely accessible online: the National Oceanic and Atmospheric Administration (NOAA) Climate Explorer app, and the Climate Central Surging Seas, Mapping Choices app. The Climate Explorer tool uses weather information recorded by meteorological instruments at weather stations to reconstruct past climate changes. It uses supercomputer simulations of future climate changes under both high and low emissions scenarios. The Surging Seas tool combines historic flood statistics and local sea level trends with global scenarios of sea level increases, which were compiled in the 2014 U.S. National Climate Assessment. Data from simulations like these is then combined with studies of local economy, current local policy, and state infrastructure to create resources like America’s Preparedness Report Card from Climate Central and ICF International. This resource synthesizes climate and sociological data and grades each state on its level of preparedness for each of five future climatological hazards related to climate change. Human consequences: In America’s Preparedness Report Card, Oregon as a whole received an “F” in Extreme Heat preparedness. Though extreme heat is not currently a major risk to the state, the projected increase of extreme heat days and Oregon’s lack of policy or public health plans designed to deal with that increase leaves Oregon, and Multnomah County, in a risky position. Extreme heat disproportionately harms vulnerable populations like the elderly, young children, and people experiencing homelessness. Without proper planning, Multnomah is unprepared for the public health costs and risks to its citizens that an increase in extreme heat days will bring. The increased frequency of wildfires and decreased air quality overall in the city of Portland already affects Multnomah county residents, and is predicted to worsen in coming decades, leaving asthma sufferers and others with compromised respiratory systems at particular risk for life threatening health complications. On a more general level, the Willamette Valley, including Multnomah County, is the most diverse agricultural area of the state, and is, therefore, reliant on predictable and consistent climatological and weather patterns to maintain this industry sector. Agriculture and recreation are major sectors of the Oregon economy, and even more so for Multnomah County at the intersection of agriculture and tourism from Portland. Therefore, damage from climate change—droughts and subsequent crop failures, urban space loss, and resident migrations—would be a major financial burden to the area. When surveyed, residents of Multnomah county have a higher than average awareness of climate issues, as well as higher than average concern over the impact of climatological effects. However, despite local governmental and community adaptations made to address the changing climate, a few key oversights leave Multnomah County vulnerable to the public health and infrastructural risks of climate change. Further reading: Article author: Madelyn Rice, Georgetown University
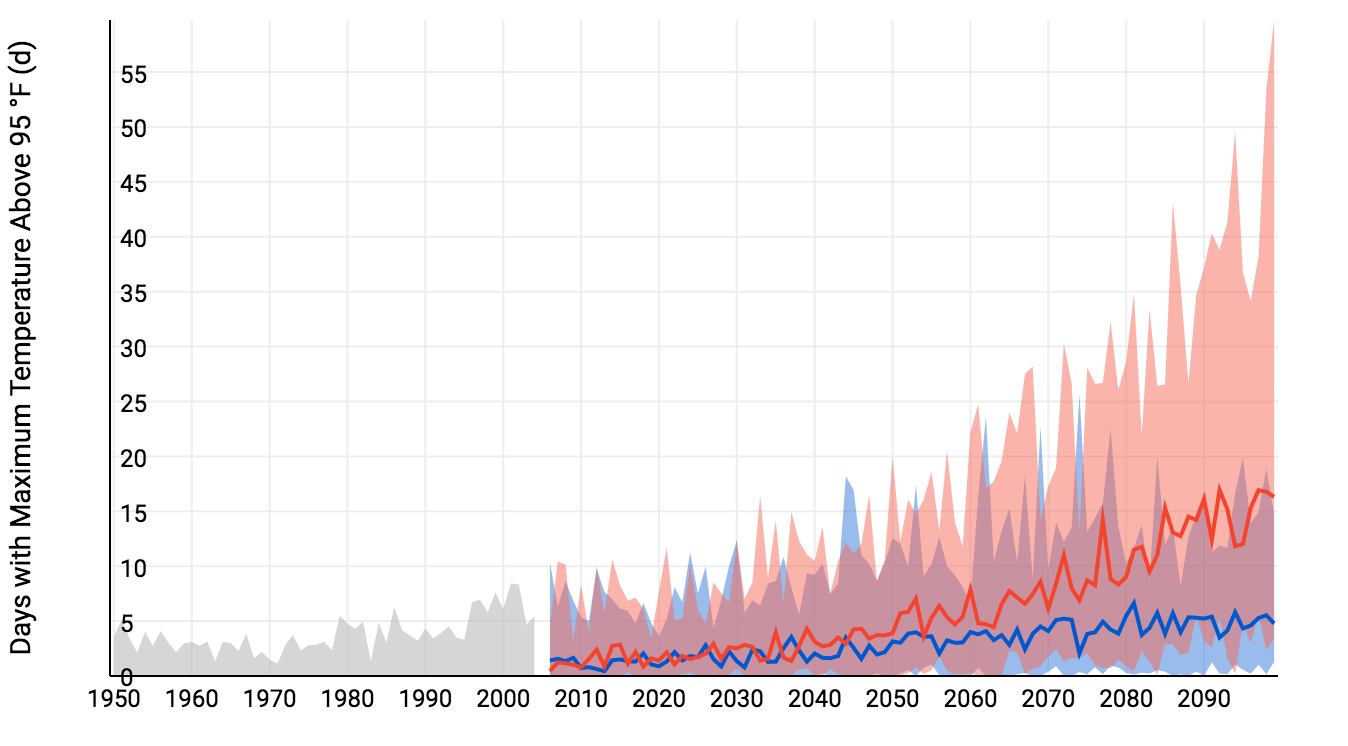
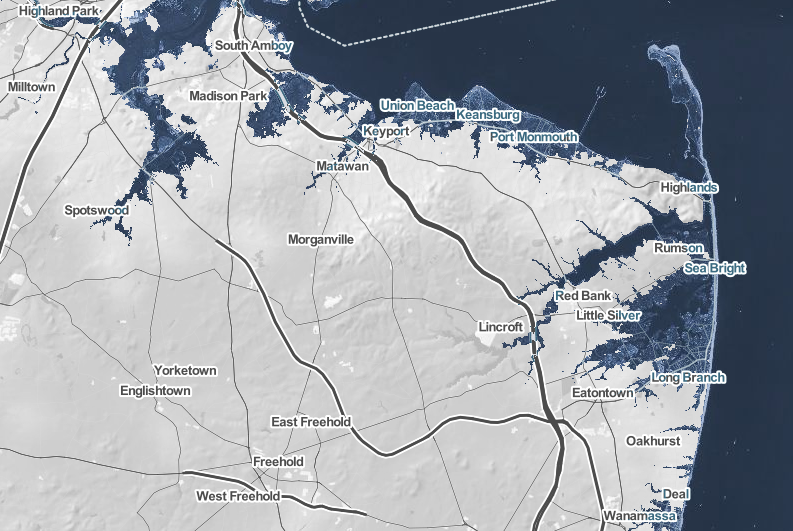
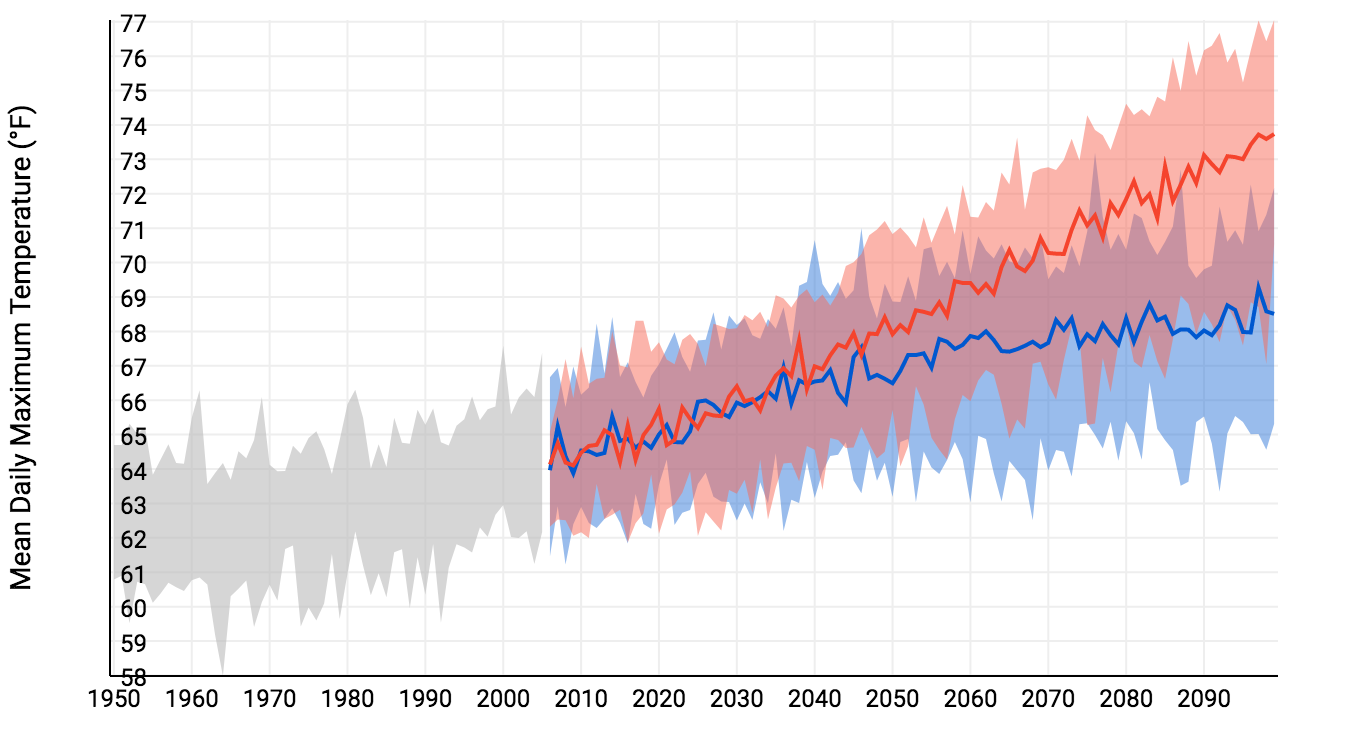
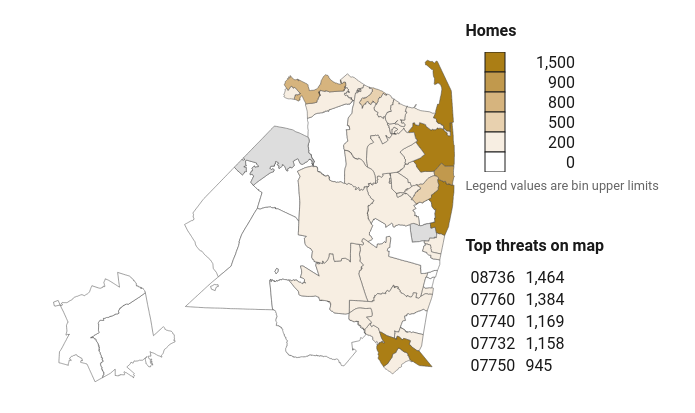
Article editor: Dr. Dagomar Degroot, Georgetown University FUTURE: rising sea levels, strengthening storms, and changing precipitation in Monmouth County3/23/2018 Climate changes and the local environment: Monmouth County spans across the lower portion of the neck of New Jersey, extending to the eastern coastline. A 2011 report from Columbia University identifies sea level, storm surge, and precipitation, all of which are expected to increase within the next century, as primary climate change associated concerns for New Jersey’s coastal areas. High concentrations of long-lived greenhouse gases like carbon dioxide and methane in the atmosphere are causing warmer global temperatures. The result is thermal expansion and melting glacier mass that contribute to an increase in sea levels. Sea levels along the Jersey Shore have already risen 0.36 meters in the last century, and that number will increase sixfold to 2 meters by 2100. Moreover, a 2ºC increase in global temperatures will further this sea level increase to 4.7 meters. The renown beaches of the area will cease to exist as a result of sea level rise, negatively affecting marine life. Resulting higher flood levels will also disrupt wetlands and terrestrial life further in the county as they become open water. Plant composition and communities will, in fact, change, a disruption that will resonate with other organisms. Warming global temperatures will also increase the amount of precipitation the county will experience. Early snowmelt will make for wetter winter and spring months though this will actually intensify summer dryness. The warmer ocean surface temperatures are also likely to increase both the frequency and intensity of hurricanes that hit the area. Hurricanes increase both in frequency and in strength with warming sea surface temperature (SST). Projections predict more hurricanes like 2011’s Irene and 2012’s Sandy, both of which disrupted activity in Monmouth County, mostly due to flooding. How we know: These projections primarily rely on two tools that are freely accessible online: the National Oceanic and Atmospheric Administration (NOAA) Climate Explorer app, and the Climate Central Surging Seas, Mapping Choices app. The Climate Explorer tool uses weather information recorded by meteorological instruments at weather stations to reconstruct past climate changes. It uses supercomputer simulations of future climate changes under both high and low emissions scenarios. The Surging Seas tool combines historic flood statistics and local sea level trends with global scenarios of sea level increases, which were compiled in the 2014 U.S. National Climate Assessment. Human consequences: The continuing increase in global temperatures will impact important industries, local businesses, and homes significantly as sea levels rise due to warming oceans and melting glacier mass. Beach erosion will contribute to much of the blow the region receives since they serve as a great source of revenue for the area by attracting tourists and allowing the growth of local businesses. The county’s coastal lakes are also integral in its commercial and recreational activities, and significant changes in the waters present an alarming concern for Monmouth county inhabitants. Notably, the shellfish industry that makes up 66% of New Jersey’s commercial fishing revenue is at risk as the population of such organism decrease as a result of ocean acidification. Similarly, homes along the coast will be destroyed due to greater storm surges. Over 9,000 homes ($5 billion in property value) housing 18,000 people will be at a 97% risk if Monmouth County sea levels reach the projected 4.7 meters. Thus, the livelihood of the county’s coastal inhabitants is in danger due to anthropogenic global warming leading to rising sea levels and flooding. The impacts of these climate change related changes will be especially hard-felt among low-income communities who have a high vulnerability. Moreover, hazardous waste sites that in areas predicted to experience high level of flooding present an additional worry for Monmouth County as flood waters can release harmful materials. While 2100 and the projected sea level and flooding changes seem far away, the threat they pose calls for immediate action. New Jersey has taken several mitigation measures to increase the resilience of its inhabitants. However, these efforts only confer higher taxes on the population in order to push forward rebuilding initiatives. Further reading: Article author: Armelle Déjoie, Georgetown University
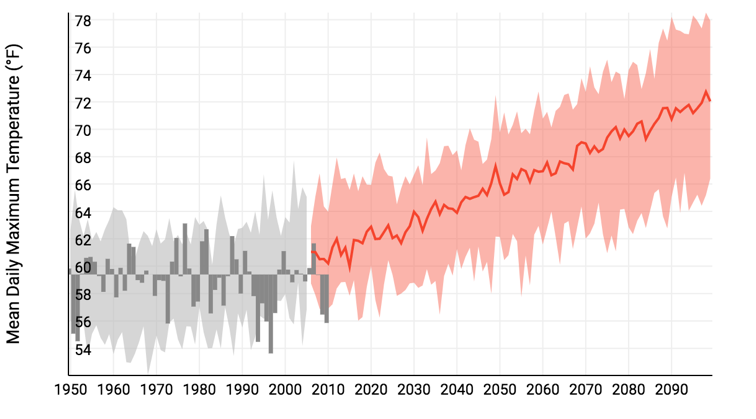
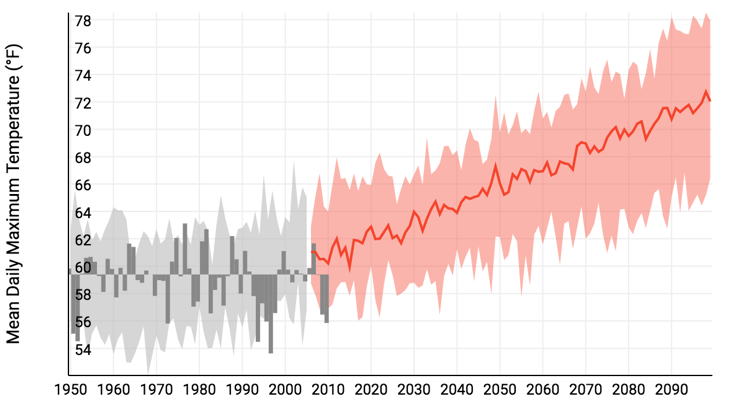
Article editor: Dr. Dagomar Degroot, Georgetown University Climate changes and the local environment: As the concentration of greenhouse gases increases, temperatures are expected to rise across the United States. Under a high emissions scenario, which occurs if greenhouse gas emissions continue to increase, Buffalo County could see an increase in mean daily maximum temperature from 61˚F to 72˚F by 2100. The average number of days with a minimum temperature below 32 ˚F between 1950 and 2004 was 168 days. This figure is projected to decrease to approximately 110 days by 2100. On the other hand, the number days with a maximum temperature above 95 ˚F will increase from 20 (1950 to 2004 average) to 70 days by 2100. This is significant as this represents an approximately 250% change in days with high heat. It should be noted that the specific figures for the predicted temperature changes are based on the median predicted value from all projections under the high emissions scenario. As the temperature increases, the amount of precipitation is also expected to rise by up to 35 percent, particularly in the spring, compared to the 1960-1970 average by 2080 under a high emissions scenario. However, a large portion of this increase will be accounted for by heavy downpours and more intense storms because as the air warms it is able to hold and then consequently release more water vapor. Because of this, Buffalo County will see an increase in both the risk and severity of summertime drought. The state of South Dakota is projected to see a 75% increase in its summer drought threat index. Additionally, the soil is expected to become drier as the warmer temperatures increase the rate of evaporation and water use by plants. Increased precipitation will only partially offset this because with a higher number of heavy precipitation events the ground will absorb less water and more will run off. The runoff, especially into the Missouri River, which borders Buffalo County, will increase the risk of inland flooding. How we know: The projections for temperature and precipitation come from the publically available US Climate Resilience Toolkit and Climate Explorer developed by the National Oceanic and Atmospheric Administration (NOAA). Based on historical weather data collected from weather stations in Buffalo County and surrounding areas, it computes models of future precipitation and temperatures under both high and low emission scenarios. Information about the drought and inland flooding risk comes from States at Risk’s Report Card for South Dakota developed by analysts at Climate Central and ICF International. The report assesses how much a state is threatened by and prepared for future extreme heat, drought, wildfires, inland flooding, and coastal flooding. Information about predicted changes in the soil come from a 2016 Environmental Protection Agency report “What Climate Change Means for South Dakota.” Human consequences: Although the predicted climate changes are less severe in Buffalo County than in other parts of the United States, their impacts are exacerbated by the fact that this county is the second poorest in the United States (2017) and that its residents are part of one of the most marginalized groups in the United States. The majority of Buffalo County is part of the Crow Creek Indian Reservation inhabited by the Crow Creek Sioux Tribe. Of the 2,038 residents, 74.9% are Native American and 18.5 % are white. With the lowest median per capita income in the United States and with more than 70% of the residents unemployed, roughly 50 % of the population lives under the federal poverty line. Many homes in this county lack indoor plumbing and kitchens. Families struggle to pay their electric and heating bills. Increased inland flooding especially for those living near the Missouri River and the associated property damages will present an increased economic burden in the future. As the number of days with freezing temperature decrease, people will need to heat their homes for less days a year relieving some financial strain. The number of days with extreme heat will increase, but most families cannot afford air conditioning. High heat will have detrimental health effects on the elderly, young children, and people with pre-existing conditions, such as asthma. The changes in temperature, precipitation, and soil moisture will also impact agriculture in this county. Shorter, more mild winters and warmer summers may extend the growing season, but will also increase the abundance of pests and weeds. However, the drier soil and increased risk of droughts threaten crop yield. Agriculture is the second most common form of employment here, and therefore, changes threaten to make a poor population even poorer. Most importantly, the predicted threats will impact the religion and cultural of the population living here. The Sioux tribes have a deep spiritual connection to the land, water, and animals. In response to the projected increase in temperatures and precipitation, wildlife will shift their ranges and migration patterns and will face habitat loss and heightened mortality. Many traditional foods gathered from the grasslands, including plants, roots, fruits, and mushrooms, will experience a change in their timing and abundance. These changes threaten the deep relationship the residents of this county feel with the environment around them. Climate change will not only continue the cycle of poverty in Buffalo county but will also impact their traditions. Further reading: Climate Change Perspectives from Indian Country. The Hill What Climate Change Means for South Dakota. EPA Article author: Anna Braendle, Georgetown University
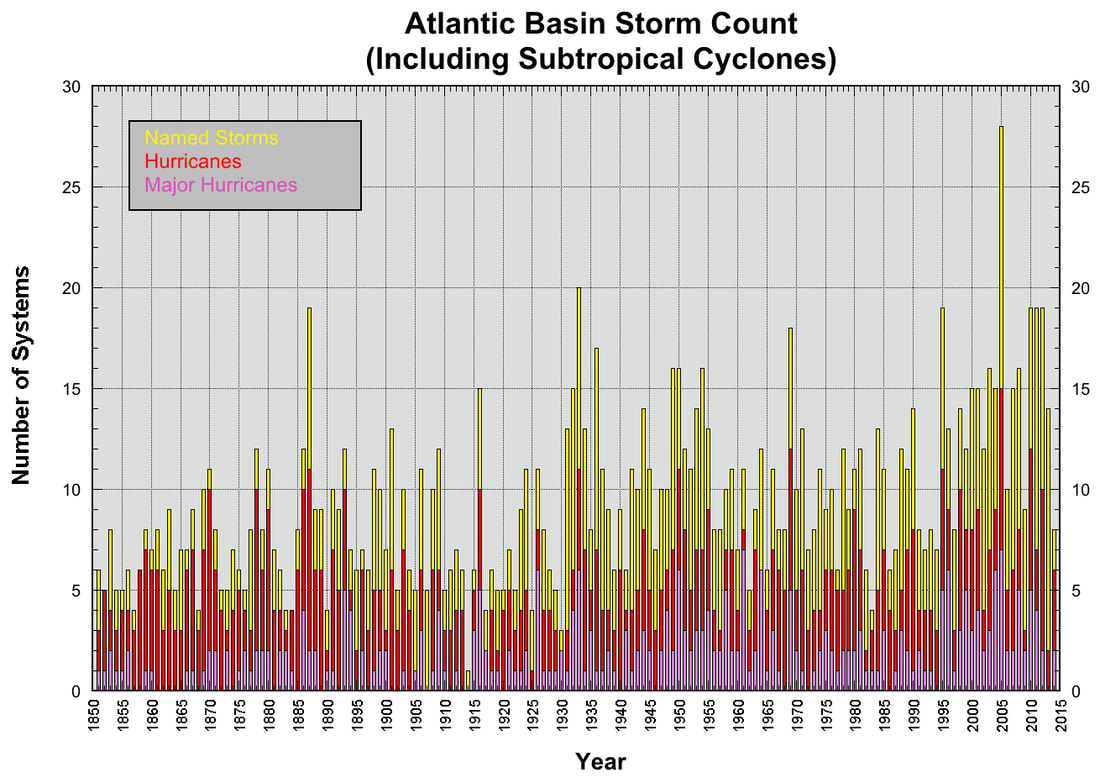
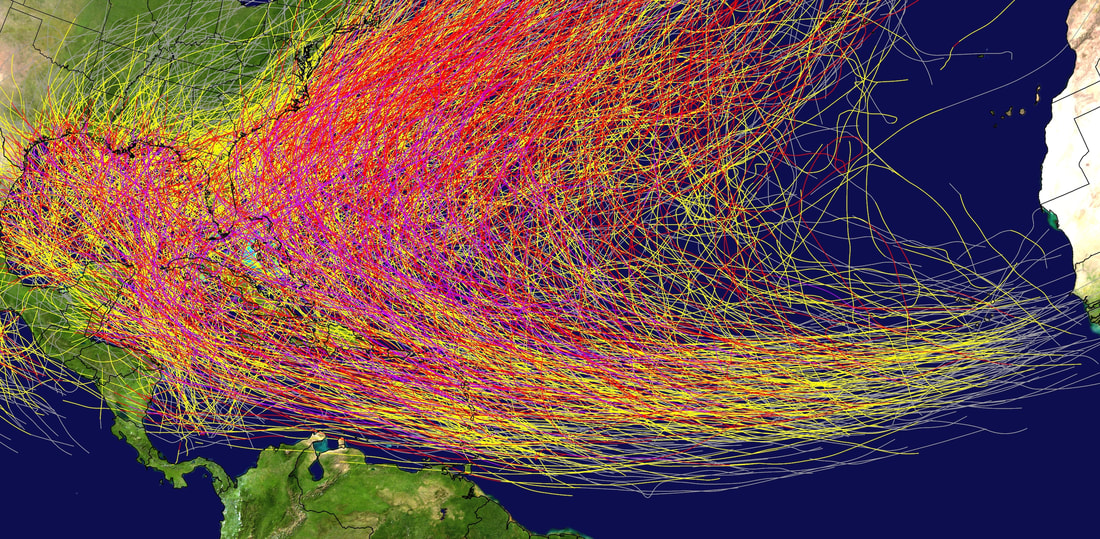
Article editor: Dr. Dagomar Degroot, Georgetown University Climate changes and the local environment:Haiti is a country prone to extreme weather: floods, droughts, and especially hurricanes. Typically, hurricanes make landfall on the southern coast of Haiti, and as a result communities located there experience the greatest storm surges. The largest city on a south-facing coastline is the commune of Gonaïves. The frequency of Atlantic hurricanes has increased sharply since the 1980s, and seems to have risen overall since the 19th century. However, it is hard to determine exactly how many hurricanes churned through the Atlantic before the widespread use of weather satellites. Our understanding of long-term trends in hurricane frequency may therefore be skewed by early underreporting of remote or short-lived hurricanes. Still, it seems clear that major hurricanes in particular have grown more common as sea surface temperatures warm across the Atlantic, and particularly in the Caribbean Sea. Hurricanes are fueled by warm, moist air rising from warm water. The warmer the water, the more fuel hurricanes can use. The most powerful hurricanes, with sustained winds at or above 130 mph (209 km/h), have rarely made landfall in Haiti. Category 5 hurricane Irma, for example, only lightly grazed northern Haiti. Yet substantial hurricanes have recently made made landfall in Haiti and caused catastrophic flooding in Gonaïves. Moreover, hurricane storm surges are higher now than they once were, owing in part to a modest but sustained increase sea levels on the Haitian coast. Hurricane floods have also been slow to recede from Gonaïves, owing to surrounding mountains that trap water within the commune. Long-lasting floods have raised the salinity of soil and groundwater around Gonaïves, and have thereby repeatedly hindered rice cultivation. Meanwhile, deforestation on and around the mountains near Gonaïves has led to mudslides amid torrential rainfall during and after hurricanes. How we know:This summary makes use of reconstructions compiled by the National Oceanic and Atmospheric Administration (NOAA) National Hurricane Center, which provides easy to use visualizations that record the history of hurricanes in the Atlantic Basin. It also draws on an overview of changes in hurricane frequency provided within the U.S. National Climate Assessment, and a skeptical assessment of hurricane trends published by the NOAA Geophysical Fluid Dynamics Laboratory. Human consequences:Haiti today is almost entirely deforested, and that has greatly increased the vulnerability of its coastal cities to hurricanes. Beginning in the seventeenth century, European settlers imported slaves from Africa to work in plantations that destroyed much of the indigenous forest of the island of Hispaniola, which includes Haiti. Late in the twentieth century, impoverished Haitians destroyed almost all the forests that remained in order to exploit charcoal. With oil and coal too expensive for most Haitians to afford, charcoal provided one of the few accessible sources of fuel. Exposed hillsides now offer no resistance to floodwaters, and easily crumble in devastating mudslides. Meanwhile, nearly all of Haiti's watersheds are deforested. In this context, active hurricane seasons can provoke human suffering on a vast scale across Haiti, and those seasons have grown more common. In 2004, for example, Hurricane Jeane dropped 13 inches of rain on the northern mountains of Haiti and caused catastrophic flooding in and around Gonaïves. Nearly 3,000 Haitians lost their lives. In 2008, no fewer than four hurricanes made landfall in Haiti. Floods were particularly devastating in Gonaïves, but overall houses belonging to nearly 800,000 Haitians were either damaged or destroyed. Floods swept away roughly 70% of Haiti's crops and thereby provoked widespread hunger and malnutrition. Festering flood waters provided ideal conditions for the spread of cholera, malaria, and West Nile disease. In 2016, Hurricane Matthew, a major category 4 storm, devastated southern Haiti and killed over 900 people. Haitians have not remained passive in the face of these challenges. Recently, the Haitian government has partnered with international aid groups and celebrities to launch a major reforestation program. International efforts, meanwhile, aim at reducing social and gender inequality across Haiti, and thereby fostering resilience to climate change in communities such as Gonaïves. Article author: Armelle Déjoie, Georgetown University
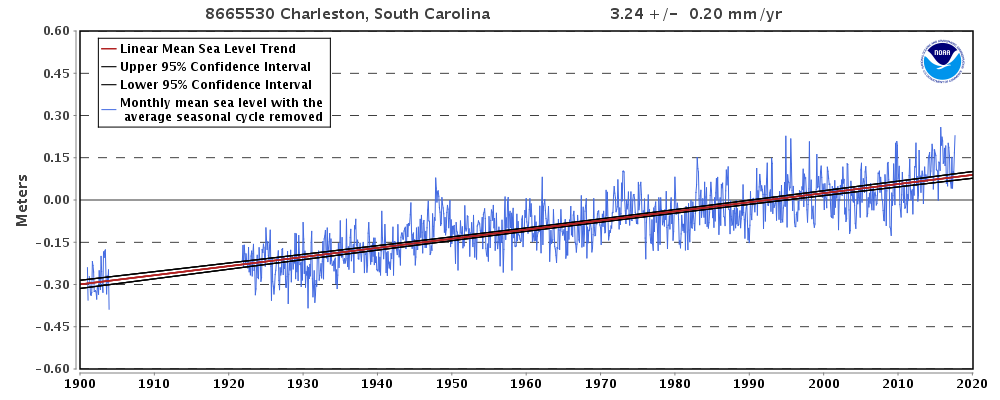
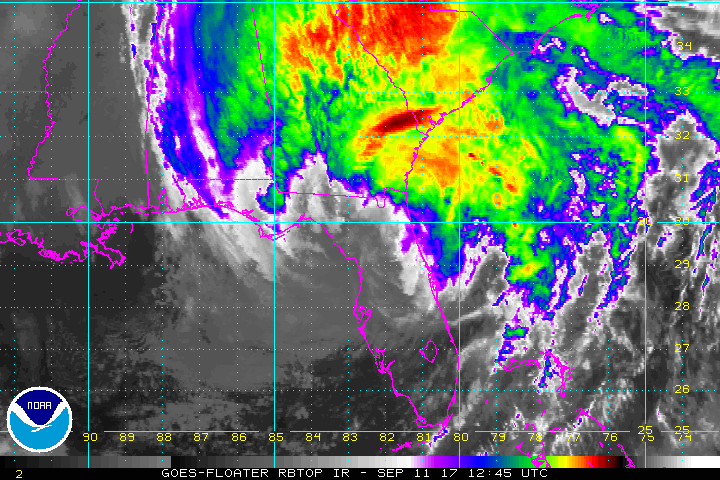
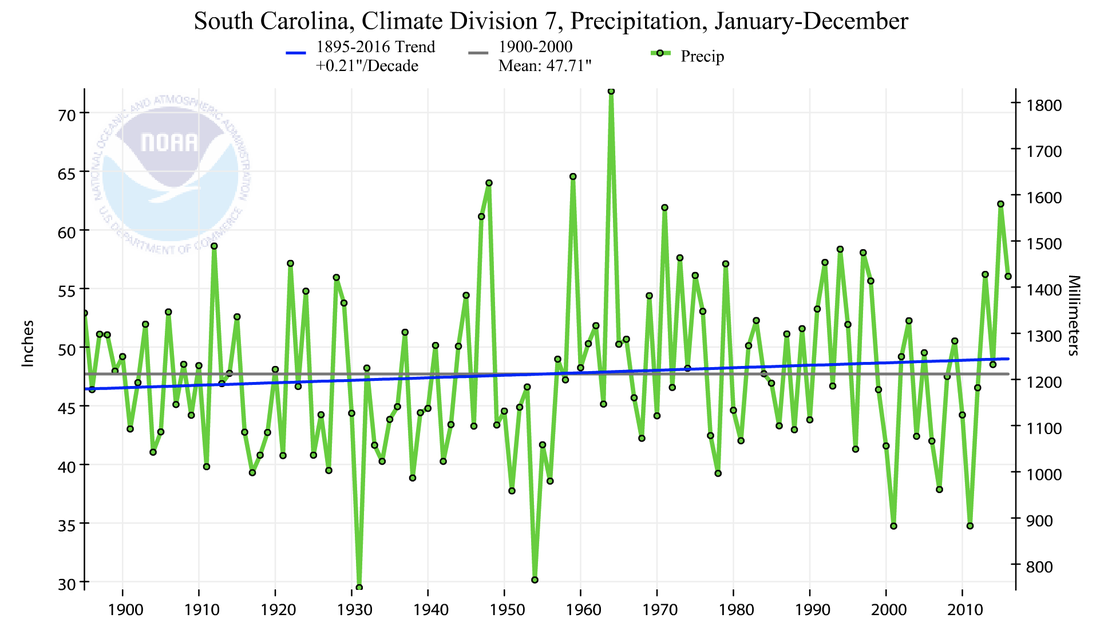
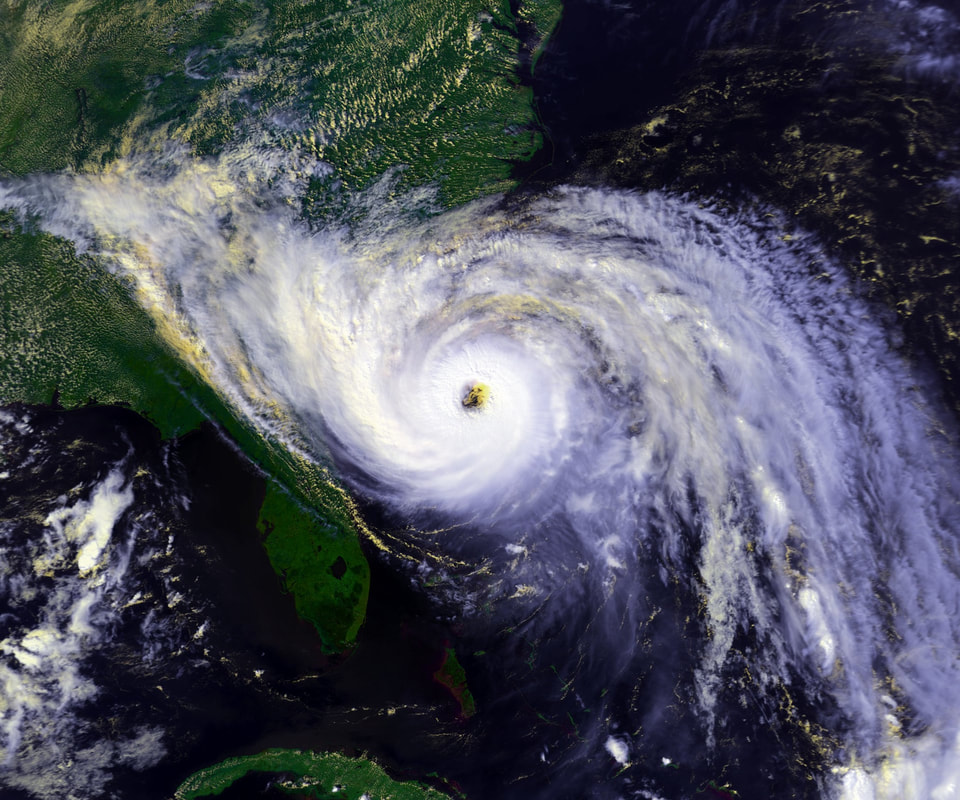
Article editor: Dr. Dagomar Degroot, Georgetown University Climate changes and the local environment:Mean global sea levels have risen by at least 17 cm (nearly 7 inches) in the twentieth century. Yet regional variations in ocean temperatures, prevailing winds, ocean currents, and the rise or fall of Earth's crust mean some areas have experienced, and will experience, greater sea level increases than others. Over the past century, sea levels of Charleston, South Carolina have risen by nearly one foot (30 cm, or 12 inches), and have increased by an average of 3.2 mm per year. In recent decades, rising sea levels have sharply increased the risk of flooding in Charleston during periods of heavy rain. Average annual precipitation has increased only modestly in Charleston, but rainstorms have grown significantly more common. As sea levels climbed, floodplains have also increased in size, meaning that more people and property each year became vulnerable to flooding. Nuisance flooding, or flooding from high tides without a storm, is four times more common in Charleston today than it was in 1950. Meanwhile, hurricanes and tropical storms have grown more powerful and more capable of causing catastrophic flooding when they make landfall. From 1975-1989, roughly 20% of hurricane strengthened to category 4 or 5, with winds at or above 130 mph (209 km/h). From 1990-2004, the share that reached at least category 4 had increased to 25%. Hurricanes are fueled by warm, moist air rising from warm water. The warmer the water, the more fuel hurricanes can use. In recent years, sea surface temperatures have provided ample fuel for hurricanes that ultimately made landfall in South Carolina. Hurricane Matthew made landfall in 2016, and hurricane Irma reached Charleston as a tropical storm in 2017. Though much weakened from the historic intensity it reached in Caribbean, Irma brought a high tide of nearly 10 feet to Charleston, which sent flood waters cascading into the city. How we know:This information draws on a National Oceanic and Atmospheric Administration (NOAA) study that connects global warming and hurricanes, and a widely-cited 2006 study in the journal Science that reconstructs changes in the frequency of the most powerful tropical cyclones. It also makes use of reliable, easy to use tools that are freely available online: the the NOAA Climate at a Glance app, and the NOAA Tides and Currents resource. The Climate at a Glance tool uses data collected at weather stations and stored in NOAA's U.S. Climate Divisions database. The Tides and Currents tool reconstructs sea level trends using measurements from U.S. and Global Stations, screening out regular seasonal fluctuations due to coastal ocean temperatures, salinities, winds, atmospheric pressures, and ocean currents. Human consequences:Tropical storms and hurricanes have crippled coastal cities like Charleston. In 1989, for example, hurricane Hugo swept ashore in South Carolina as a category 4 storm. It was fast-moving, and it therefore dropped only a relatively modest amount of rain. Yet its power resulted in a storm surge that reached 20 feet in some stretches of the South Carolina coast. Sustained winds in downtown Charleston reached 87 mph (140 km/h), but gusts exceeded 108 mph (174 km/h). The wind and water destroyed rows of beach houses, shattered docked boats, and collapsed part of the Ben Sawyer Bridge. The storm caused nearly $12 billion (2017 USD) in damage and directly or indirectly resulted in 35 deaths across South Carolina. In 2017, Irma sent roughly 4 feet of ocean water spilling into downtown Charleston and caused the worst flooding in the city since Hugo made landfall. Since residents had not been ordered to evacuate, many were caught off guard by the flooding, and some needed rescuing. Irma was the costliest storm to reach Charleston since Hugo, and caused well over $1 billion in damage across South Carolina. Less damaging but far more common nuisance floods have also imposed high costs on coastal communities across South Carolina, including Charleston. Tidal floods have inundated and therefore closed roads, and even modest floods have damaged vehicles exposed to the salty water. Heavy rain, meanwhile, has repeatedly caused flooding that drainage systems can only gradually alleviate. Since 1990, taxpayers in Charleston have spent over $238 million to repair drainage systems damaged by tidewater. The worst flooding in Charleston has occurred in former marshes that once provided protection from rising waters but have now been filled in for development. Particularly at risk areas are actually sinking relative to the sea, since many were built on soil deposited by bulldozers that has grown more compact with time. Efforts have been made to stabilize beach houses and "renourish" beaches, which involves expanding beaches with sand from other sources. These ongoing initiatives have fortified at least some of the South Carolina coast in the face of rising seas. Further reading:The Front Lines of Climate Change: Charleston’s Struggle. Climate Central Your Post-Storm Update: Charleston Assesses Irma's Damage. The Post and Courier Article author: Kevin Berning, Georgetown University
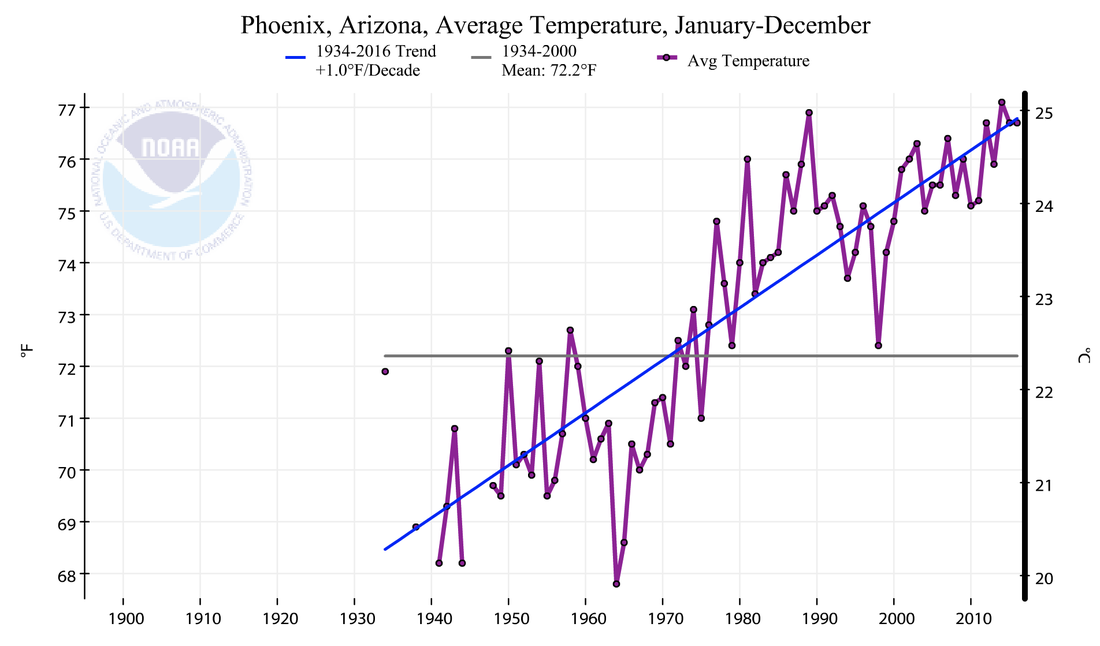
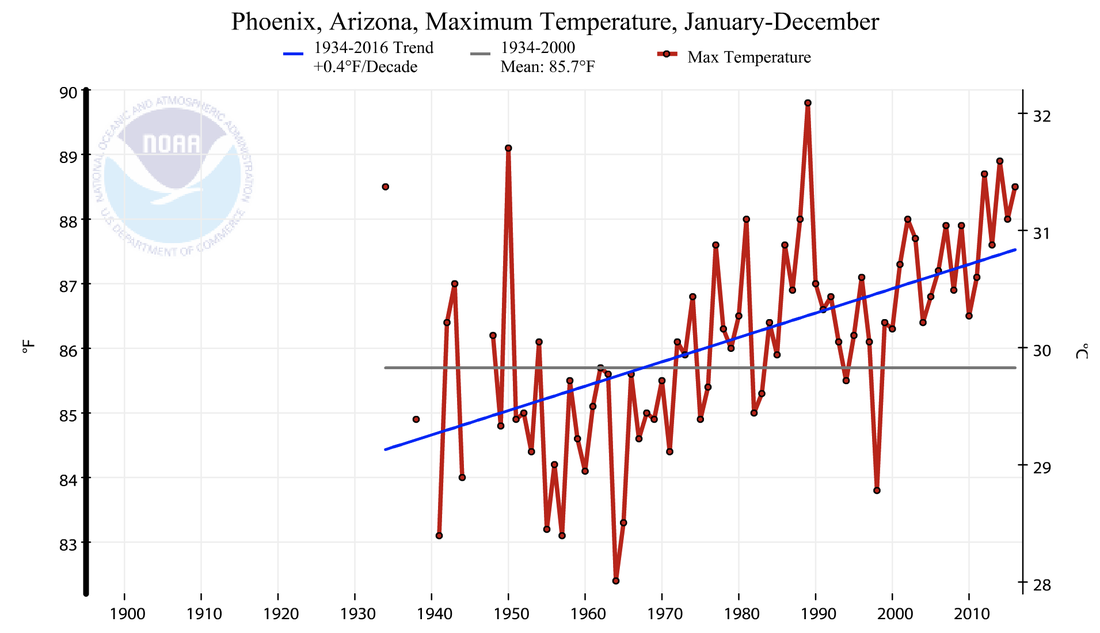
Article editor: Dr. Dagomar Degroot, Georgetown University Climate changes and the local environment:Since 1970, average annual temperatures in Arizona have soared. In densely-populated Maricopa County, which includes Phoenix, average annual temperatures have risen by over 7° F (nearly 4° C), which is roughly four times the global average. In no major U.S. city have temperatures climbed more quickly. This remarkable rise has sharply increased the frequency of particularly extreme weather. In the summer of 2017, for example, a heat wave sent temperatures soaring to over 120° F (nearly 50° C). Summer days with relatively cool temperatures, by contrast, have grown scarce. From June to September 2017, only 14 days had high temperatures lower than 100° F. Higher temperatures have increased rates of evaporation across Arizona, and therefore dried much of the state. Average annual precipitation in Maricopa County has actually increased slightly over the past century, yet precipitation in mid to late summer has declined substantially. Summer droughts have therefore become common in Maricopa County. Warming, drying trends have created ideal conditions for wildfires across Arizona, including in Maricopa County. Wildfires in Arizona have therefore grown more frequent, and they last longer. In spring 2017, a wildfire in Maricopa County’s Tonto National Forest consumed some 500 acres of woodland. How we know:These reconstructions are largely based on reliable, easy to use tools that are freely accessible online: the National Oceanic and Atmospheric Administration (NOAA) State Annual and Seasonal Time Series, the NOAA Climate at a Glance app, the National Drought Mitigation Center's United States Drought Monitor. NOAA's State Annual and Seasonal Time Series and Climate at a Glance tools use data collected at weather stations and stored in NOAA's U.S. Climate Divisions database. The Drought Monitor compiles weekly maps of drought conditions across the United States, and combines climate, soil, and water data with reports from 350 experts across the country. Human consequences:Rising summer temperatures in Arizona have increased the number of heat-related deaths in Maricopa County. Especially hot, dry weather can provoke dehydration and heat stroke, and can interfere with cardiovascular, respiratory, and nervous systems. The very old, the very young, and the sick are especially vulnerable, particularly in poor neighborhoods where some households might not have dependable access to air conditioning. Employees who spend most of their time outside - such as construction workers - are also at risk. Heat-related threats to human health can be especially great in cities like Phoenix, where paved surfaces create urban heat sinks that amplify hot temperatures. In 2016, Maricopa County endured 130 heat-related deaths, the most in the last 15 years. On average, Arizona hospitals now treat almost 2,000 patients per year for heat-related illnesses. Many injuries and deaths not only reflect warming trends, but also social and infrastructural problems that make it hard for people to escape the heat. Wildfires in Arizona, including in Maricopa County, have also proven costly for state and federal governments. Containing the Arizona wildfires has cost many millions of dollars, and the total costs of wildfires can exceed suppression costs by more than 30 times. In Maricopa County, smoke billowing from fires in Tonto National Forest, for example, shut down Bush Highway. Foresters have conducted controlled burns to limit the future risk of major wildfires in the forest, but prolonged drought has foiled some of these efforts. In Phoenix, the municipal government has taken steps to lower the city's contribution to climate change. It has expanded public transit, constructed new bike lanes, purchased electric vehicles, installed low-energy bulbs in street lighting, and set ambitious goals for cutting greenhouse gas emissions. Still, adapting to climate change has proven to be an even more daunting task, especially for the city's less affluent residents. Further reading:A Building Boom and Climate Change Create an Even Hotter, Drier Phoenix. LA Times Phoenix Will Be Almost Unlivable by 2050 Thanks to Climate Change. Vice Article author: Luke Powers, Georgetown University
Article editor: Dr. Dagomar Degroot, Georgetown University |



 RSS Feed