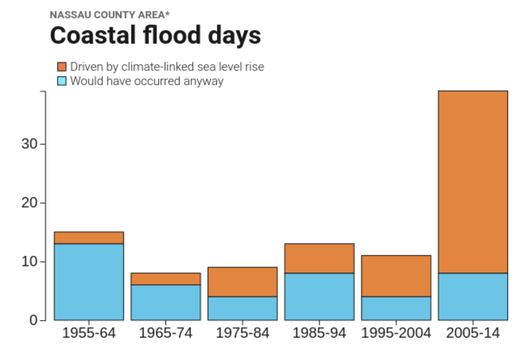
 Coastal flood days in Nassau County, categorized as floods driven by climate-linked sea level rise or those that would have occurred anyway. Source: Surging Seas Risk Finder Climate changes and the local environment:For coastal communities such as New York City, global warming is a particularly pressing threat and its effects have already been experienced. Over the past century, the concentration of greenhouse gases in the atmosphere has increased, thus raising the global average temperature. With temperatures rising, sea levels rise as well. Global sea level rise can be attributed to two main factors: Arctic ice caps are melting, and oceans are warming thus expanding in volume. Rising sea levels have left New York City vulnerable to floods and storm surges. Historically, one important line of defense for these coastal areas have been salt marshes, which are estuaries where fresh and saltwater mix. Jamaica Bay is an estuary that can be found in the highly urbanized intersection between the Brooklyn and Queens boroughs, and is particularly valuable for both the humans and the natural environment. 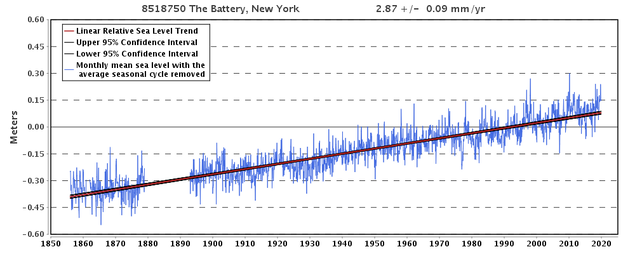 Changes in sea level in The Battery, New York from 1855 through today. Source: NOAA Tides and Currents. 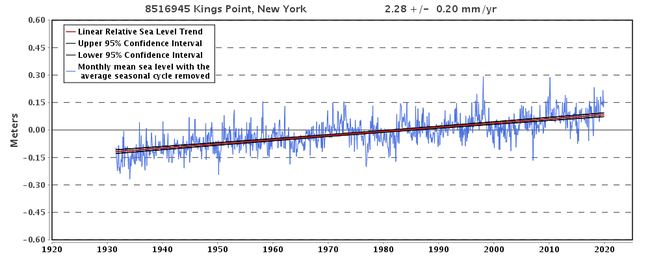 Changes in sea level in Kings Point, New York from 1930 through today. Source: NOAA Tides and Currents. During the last one hundred years alone, local sea levels have risen by nearly 30cm in New York City, with the rate of sea level rise in Jamaica Bay being almost twice the mean global rate. These two graphs, taken from NOAA’s Tides and Currents website, depict historic sea level is rise in Kings Point and The Battery in New York City. This data can be used to extrapolate the changes in sea level for Jamaica Bay, due to their proximity and similar conditions to the salt marsh. Salt marshes like Jamaica Bay provide some protection from the effects of sea level rise by slowing wave velocity, absorbing excess rainwater, and mitigating storm surges. They also protect shorelines from erosion by buffering wave action and trapping sediments. Additionally, they provide numerous other ecological benefits such as high biodiversity, improved water quality, flood reduction, and carbon sequestration. 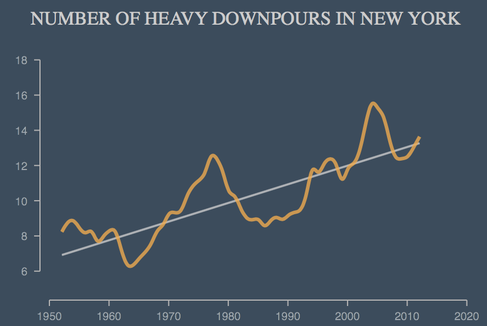 Graph displaying the overall upward trend of severe storms in New York from the 1950's to the present. Source: Climate Central. In addition to contributing to sea level rise, warming temperatures lead to an increase in evaporation, and thus, an increased frequency in storm events. Higher sea levels and storm events work synergistically – the greater the sea level rise, the more flooding each storm will bring, as well as more wave intensity and greater erosion. With New York City seeing a 350% increase in heavy downpours since 1950, marshes like those in Jamaica Bay have become increasingly vulnerable to erosion and floods from these worsening storms. How we know:This information relies on data from easily two accessible online tools, including the National Oceanic and Atmospheric Administration (NOAA) Tides and Currents tool and Climate Central’s Surging Seas: Risk Finder projections. It also uses data from a Climate Central research report. The NOAA Tides and Currents resource reports local mean sea level changes from 1850 to today. It uses data collected from U.S. and global water level stations to reconstruct local sea level trends. Climate Central’s Surging Seas tool generates projections for sea level rise and flood risks, which are based on the different emissions scenarios presented in the NOAA Technical Reports. The tool additionally shows the floods that coastal locations have experienced, distinguishing between which floods are driven by climate-linked sea level rise and which would have occurred naturally. Climate Central’s Heaviest Downpours research report displays the increase in heavy downpours in the United States. At each station, a heavy downpour was defined as the top 1 percent daily precipitation amounts over the period from 1950 to 2014. The analysis is based on precipitation observations from 2,962 climate stations across the US. Human consequences:While salt marshes can be quite resilient to sea level rise, Jamaica Bay experiences a variety of other stressors that make it particularly vulnerable to this threat. Factors that exacerbate the already damaging effects of sea level rise include the general sediment deficit, a deepening of the Bay through dredging, waves generated by boat traffic, and excessive waterfowl grazing. While in less metropolitan areas, salt marsh loss can be compensated for by expanding the marsh onto adjacent upland or freshwater zones, Jamaica Bay shows the catastrophic repercussions of deteriorating salt marshes that have no hopes for expansion. Salt marshes in New York are one of the primary defenses against rising sea levels for coastal areas, but have been steadily deteriorating throughout the last several centuries. In New York State, salt marshes have reduced by 60% from 1780 to 1980. Field studies conducted in Jamaica Bay show that from 1989 to 2003, the Bay’s marshes were in rapid decline losing 13.4 ha/year. From 2003 to 2013, this has declined to 2.1 ha due to restoration efforts. While the expected rising sea levels and future storms provide significant cause for concern, particularly in the Jamaica Bay region, this estuary is also a fascinating example of resilience in the face of climate change. In 2012, Hurricane Sandy tore through the northeast, causing significant flooding and massive devastation to infrastructure and coastal lagoons in the New York City area. During Hurricane Sandy, Jamaica Bay experienced a storm surge of 8 to 10 feet during the worst of the storm. The damage felt after the storm was significant as well, with debris from destroyed homes and buildings coming from Queens and Brooklyn ultimately ending up in the Bay. Additionally, thousands of gallons of oil coming from home fuel tanks leaked into the area, creating yet another expense in the clean up after the storm. The massive damages that Jamaica Bay, and the New York region as a whole, experienced from Hurricane Sandy displayed how instrumental proper governance and human action are in dealing with natural emergencies. Disaster relief funds provided swift critical aid to the region; however, many of these efforts were contained to the short-term and were more of a response tactic, rather than a preventative measure. Despite the destruction New York City faced in 2012, human efforts have caused impressive improvement in the conditions of Jamaica Bay within the last two decades. Compared to 2003 when restorations first began, there has been a marked decrease in deterioration for the Bay. This ultimately was responsible for how swiftly the area recovered after Hurricane Sandy; however, constant monitoring is necessary, as even post-restoration, salt marsh loss continues to occur in the Bay. Considering how important Jamaica Bay has historically been for the economic, social, and ecological health of New York, it is imperative that a concerted effort be made to help inoculate this area from the threats of future climate change, as rising sea levels and stronger storms will likely increase the risks facing the region. Further reading:Five Years After Hurricane Sandy, NYC’s Coastal Communities Remain Vulnerable. Curbed New York Jamaica Bay Walloped by Hurricane Sandy. Queens Chronicle New York Today: A ‘Maritime Forest’ Where Sandy’s Waters Rose. New York Times Article Author: Nicole Sheynin, Georgetown University
Article Editor: Maddie Bowen, Georgetown University
4 Comments
FUTURE: rising temperatures, increased precipitation, and hardier crops in Marion County, Indiana4/30/2018 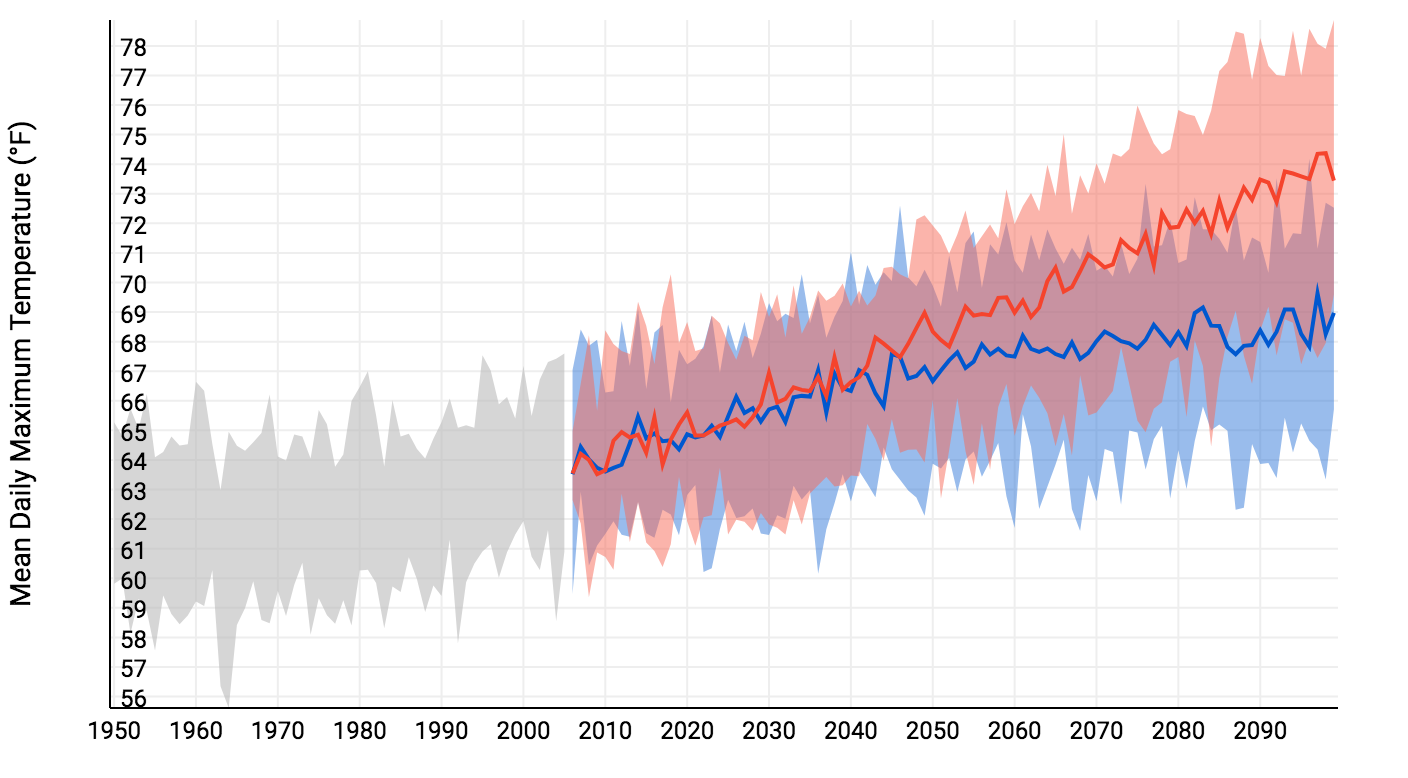 Mean daily maximum temperature for Marion County in the past (grey) and the projected future under high (red) and low (blue) emissions scenarios. Source: NOAA Climate Explorer. Climate changes and the local environment:As the amount of carbon dioxide in the atmosphere continues to increase due to human emissions, average annual temperatures in Marion County, Indiana are expected to rise from an annual average of about 63.5°F in 2007 to an average of 69°F by 2100 under “low emission” predictions, or an average of 73.5°F under “high emission” predictions. Low emission conditions are estimated by assuming that we will at least moderately decrease our emissions in the near future, while high emission conditions assume that we will do nothing to change our current behavior. Without immediate action to reduce emissions, we can expect to have almost twenty times as many extreme heat days in Marion County. Extreme heat days are days when the highest temperatures rise above 95°F. Likewise, Marion County is expected to experience three to four times as many high heat nights, defined by temperatures 68°F or above, in the coming century under low and high emission scenarios respectively. Another consequence of climate change that Marion County will face in the coming years is a likely increase in rainfall. Average annual precipitation has been increasing since 1895 in Indiana, and is expected to continue to increase in the future, possibly by 6-8% within the next half century. Most of this rain is expected in the winter and spring, leaving the summer and fall months possibly drier than they are now. With increased precipitation, we also expect to see heavy downpours more often followed by more frequent flooding.  Mean daily average precipitation for Marion County in the past (grey) and the projected future under high (red) and low (blue) emissions scenarios. Source: NOAA Climate Explorer. How we know:The projections of future climate change presented in this article come mainly from the Indiana Climate Change Impacts Assessment compiled by Purdue University and the National Oceanic and Atmospheric Administration’s (NOAA) Climate Explorer tool. Both of these tools rely on temperature and precipitation data gathered at weather stations on the ground around the county and state. These historical values are then compared to predictions for the future compiled by the United Nations’ Intergovernmental Panel on Climate Change (IPCC). The IPCC creates future predictions with advanced computer models that evaluate the climate under different emissions scenarios. Human consequences:Rising temperature and changes in rain patterns will likely have serious consequences for the health of people in Marion County. Scientists expect higher rates of dehydration, heat stroke, and death. Extreme heat can worsen pre-existing conditions, such as heart disease and diabetes, especially among children and the elderly. The number of deaths that can be linked to temperature extremes is expected to rise from 33 in 1990 to between 43 and 71 per year by 2050. As temperatures rise in Marion County, air quality may also decline. Ozone particles stay near the ground in hot weather, triggering asthma attacks and exacerbating high blood pressure. Since cold winters currently control populations of mosquitoes and ticks, warming trends could well promote a sharp increase in the number of both pests, which could in turn allow the disease they carry to infect more people. It is likely that the emissions cuts that would reduce global warming would save more lives in Indiana than in most other states. The growing season in Marion County has already lengthened significantly. By the 2050s, it is expected to lengthen by at least thirty days under high emission scenarios. The longer growing season will likely increase crop productivity in Marion County, though not as much as one might expect. The increasing number of high heat days will likely damage some crops, and the increase in precipitation during winter and spring, together with the rise in extreme precipitation events, should increasingly wash fertilizer and nutrients from the soil into nearby watersheds. Nevertheless, Indiana is likely to remain the top producer of corn and soybeans. Marion County will therefore growing increasingly uncomfortable and unhealthy for many of its residents, yet a key sector of its economy - agricultural production - may in fact benefit from at least modest warming. These benefits will likely decline sharply in high emissions scenarios, and it is therefore in the interest of Marion County residents to contribute to a lower-carbon future. Further reading:2014 EPA Clean Power Plan. EPA. Impacts of Climate Change for the State of Indiana. EPA. Indiana’s Past and Future Climate. Purdue University. Article author: Eve Kelly, Georgetown University
Article editor: Dr. Dagomar Degroot, Georgetown University 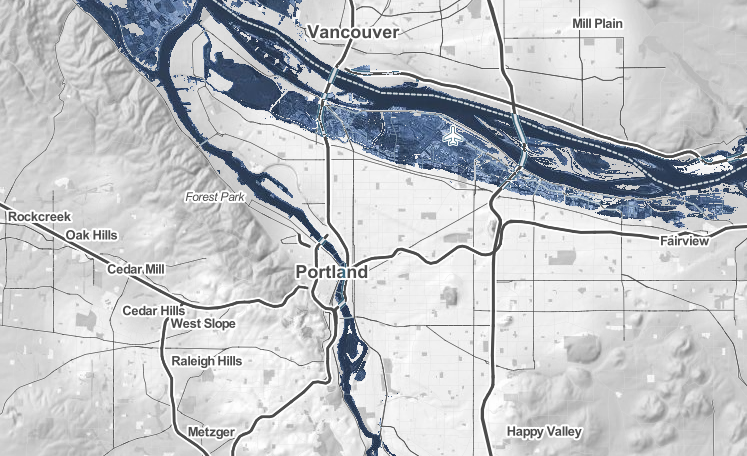 Projected sea level increases in Multnomah County given 2.5° C warming, relative to twentieth-century averages. Source: Climate Central. Climate changes and the local environment: A 2013 report from the Intergovernmental Panel on Climate Change layed out the specific ways in which global warming has changed, and will continue to shape, the planet’s many environmental systems. For Multnomah County, this means increasing average temperatures throughout the year, greater incidence of extreme heat days, and increased risk of flooding. Multnomah County, home to the city of Portland, rests on the bank of the Willamette River. Even with conservative estimates of climate change and a global increase of only 1 degree Celsius, Portland would experience significant flooding of up to seven feet. With a global temperature increase of 2 degrees Celsius, the Limit set by The Paris Agreement on Climate, Portland would see fifteen feet of flooding. Multnomah’s average temperatures are also predicted to increase, and have been increasing notably since the mid 1950s according to the chart from the National Oceanic and Atmospheric Alliance, and is predicted to rise at increasing rates for the next century. Even in the “low emissions” scenario, average temperature in Multnomah County is predicted to increase by about 4 degrees Farenheit in the next century, or up to 9 degrees Farenheit in the high emissions scenario. While Oregon as a whole has a highly variable climate, Multnomah county is a fairly consistent climate zone, ranging from a 40° F average in January to a 68° average in July. However, extreme heat days are predicted to quadruple in frequency from about ten a year in 2000 to 40 a year by 2050. This will have major sociological and economic implications for the county.  Mean daily maximum temperature for Multnomah County in the past (grey) and the projected future under high (red) and low (blue) emissions scenarios. Source: NOAA Climate Explorer. How we know: These projections primarily rely on two tools that are freely accessible online: the National Oceanic and Atmospheric Administration (NOAA) Climate Explorer app, and the Climate Central Surging Seas, Mapping Choices app. The Climate Explorer tool uses weather information recorded by meteorological instruments at weather stations to reconstruct past climate changes. It uses supercomputer simulations of future climate changes under both high and low emissions scenarios. The Surging Seas tool combines historic flood statistics and local sea level trends with global scenarios of sea level increases, which were compiled in the 2014 U.S. National Climate Assessment. Data from simulations like these is then combined with studies of local economy, current local policy, and state infrastructure to create resources like America’s Preparedness Report Card from Climate Central and ICF International. This resource synthesizes climate and sociological data and grades each state on its level of preparedness for each of five future climatological hazards related to climate change.  Severe heat day risk and preparedness in Oregon relative to the other 50 states. Source: America’s Preparedness Report Card. Human consequences: In America’s Preparedness Report Card, Oregon as a whole received an “F” in Extreme Heat preparedness. Though extreme heat is not currently a major risk to the state, the projected increase of extreme heat days and Oregon’s lack of policy or public health plans designed to deal with that increase leaves Oregon, and Multnomah County, in a risky position. Extreme heat disproportionately harms vulnerable populations like the elderly, young children, and people experiencing homelessness. Without proper planning, Multnomah is unprepared for the public health costs and risks to its citizens that an increase in extreme heat days will bring. The increased frequency of wildfires and decreased air quality overall in the city of Portland already affects Multnomah county residents, and is predicted to worsen in coming decades, leaving asthma sufferers and others with compromised respiratory systems at particular risk for life threatening health complications. On a more general level, the Willamette Valley, including Multnomah County, is the most diverse agricultural area of the state, and is, therefore, reliant on predictable and consistent climatological and weather patterns to maintain this industry sector. Agriculture and recreation are major sectors of the Oregon economy, and even more so for Multnomah County at the intersection of agriculture and tourism from Portland. Therefore, damage from climate change—droughts and subsequent crop failures, urban space loss, and resident migrations—would be a major financial burden to the area. When surveyed, residents of Multnomah county have a higher than average awareness of climate issues, as well as higher than average concern over the impact of climatological effects. However, despite local governmental and community adaptations made to address the changing climate, a few key oversights leave Multnomah County vulnerable to the public health and infrastructural risks of climate change. Further reading: Article author: Madelyn Rice, Georgetown University
Article editor: Dr. Dagomar Degroot, Georgetown University FUTURE: rising sea levels, strengthening storms, and changing precipitation in Monmouth County3/23/2018 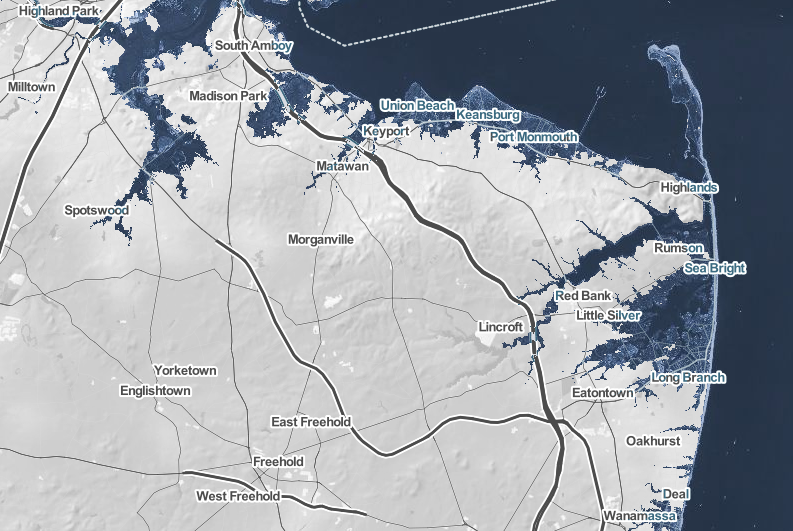 Projected sea level increases in Monmouth County given 2° C warming, relative to 20th-century averages. Climate changes and the local environment: Monmouth County spans across the lower portion of the neck of New Jersey, extending to the eastern coastline. A 2011 report from Columbia University identifies sea level, storm surge, and precipitation, all of which are expected to increase within the next century, as primary climate change associated concerns for New Jersey’s coastal areas. High concentrations of long-lived greenhouse gases like carbon dioxide and methane in the atmosphere are causing warmer global temperatures. The result is thermal expansion and melting glacier mass that contribute to an increase in sea levels. Sea levels along the Jersey Shore have already risen 0.36 meters in the last century, and that number will increase sixfold to 2 meters by 2100. Moreover, a 2ºC increase in global temperatures will further this sea level increase to 4.7 meters. The renown beaches of the area will cease to exist as a result of sea level rise, negatively affecting marine life. Resulting higher flood levels will also disrupt wetlands and terrestrial life further in the county as they become open water. Plant composition and communities will, in fact, change, a disruption that will resonate with other organisms. Warming global temperatures will also increase the amount of precipitation the county will experience. Early snowmelt will make for wetter winter and spring months though this will actually intensify summer dryness. The warmer ocean surface temperatures are also likely to increase both the frequency and intensity of hurricanes that hit the area. Hurricanes increase both in frequency and in strength with warming sea surface temperature (SST). Projections predict more hurricanes like 2011’s Irene and 2012’s Sandy, both of which disrupted activity in Monmouth County, mostly due to flooding. 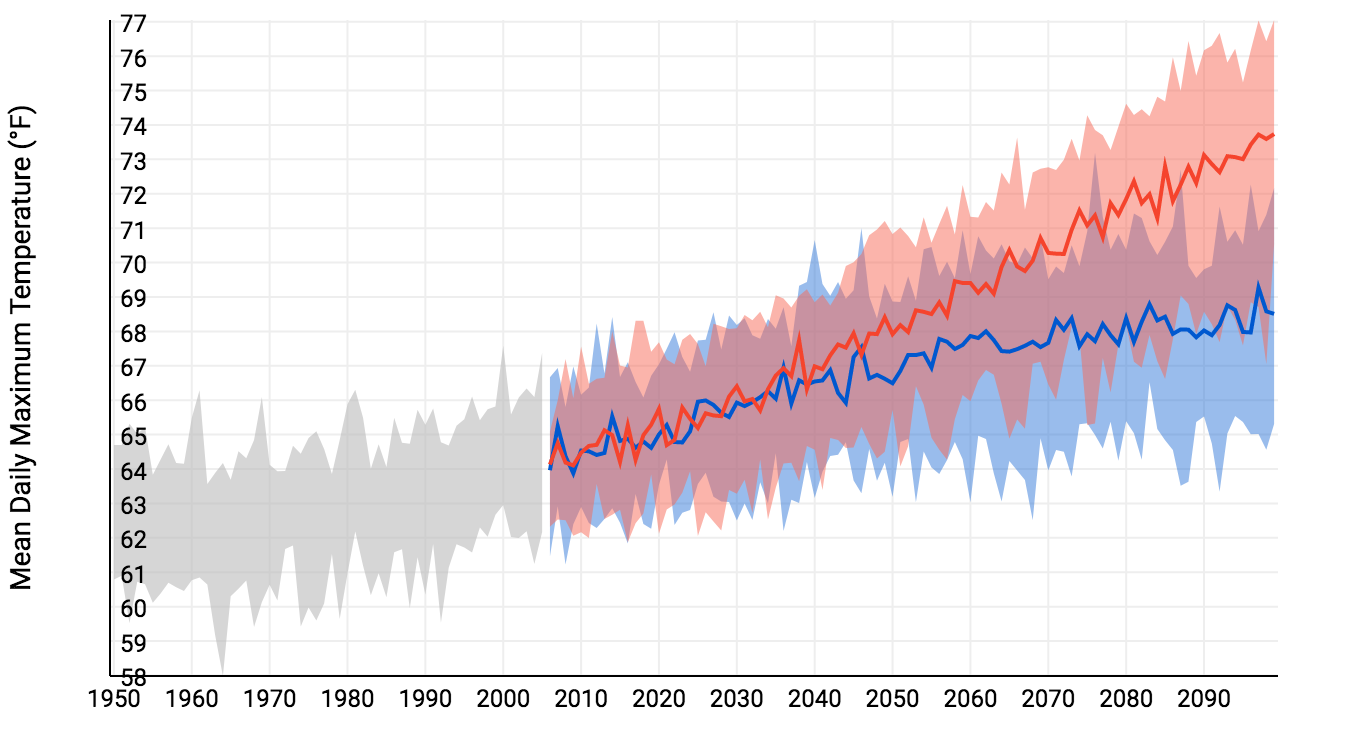 Mean daily maximum temperature for Monmouth County in the past (grey) and the projected future under high (red) and low (blue) emissions scenarios. Source: NOAA Climate Explorer. How we know: These projections primarily rely on two tools that are freely accessible online: the National Oceanic and Atmospheric Administration (NOAA) Climate Explorer app, and the Climate Central Surging Seas, Mapping Choices app. The Climate Explorer tool uses weather information recorded by meteorological instruments at weather stations to reconstruct past climate changes. It uses supercomputer simulations of future climate changes under both high and low emissions scenarios. The Surging Seas tool combines historic flood statistics and local sea level trends with global scenarios of sea level increases, which were compiled in the 2014 U.S. National Climate Assessment. 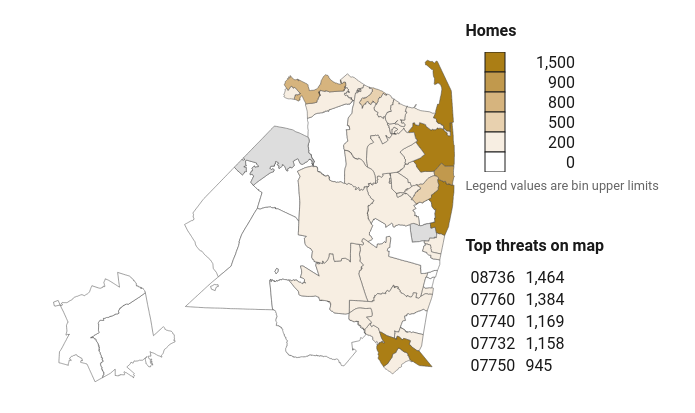 Homes less than five feet below sea level in Monmouth County, organized by zip code. Source: Climate Central. Human consequences: The continuing increase in global temperatures will impact important industries, local businesses, and homes significantly as sea levels rise due to warming oceans and melting glacier mass. Beach erosion will contribute to much of the blow the region receives since they serve as a great source of revenue for the area by attracting tourists and allowing the growth of local businesses. The county’s coastal lakes are also integral in its commercial and recreational activities, and significant changes in the waters present an alarming concern for Monmouth county inhabitants. Notably, the shellfish industry that makes up 66% of New Jersey’s commercial fishing revenue is at risk as the population of such organism decrease as a result of ocean acidification. Similarly, homes along the coast will be destroyed due to greater storm surges. Over 9,000 homes ($5 billion in property value) housing 18,000 people will be at a 97% risk if Monmouth County sea levels reach the projected 4.7 meters. Thus, the livelihood of the county’s coastal inhabitants is in danger due to anthropogenic global warming leading to rising sea levels and flooding. The impacts of these climate change related changes will be especially hard-felt among low-income communities who have a high vulnerability. Moreover, hazardous waste sites that in areas predicted to experience high level of flooding present an additional worry for Monmouth County as flood waters can release harmful materials. While 2100 and the projected sea level and flooding changes seem far away, the threat they pose calls for immediate action. New Jersey has taken several mitigation measures to increase the resilience of its inhabitants. However, these efforts only confer higher taxes on the population in order to push forward rebuilding initiatives. Further reading: Article author: Armelle Déjoie, Georgetown University
Article editor: Dr. Dagomar Degroot, Georgetown University 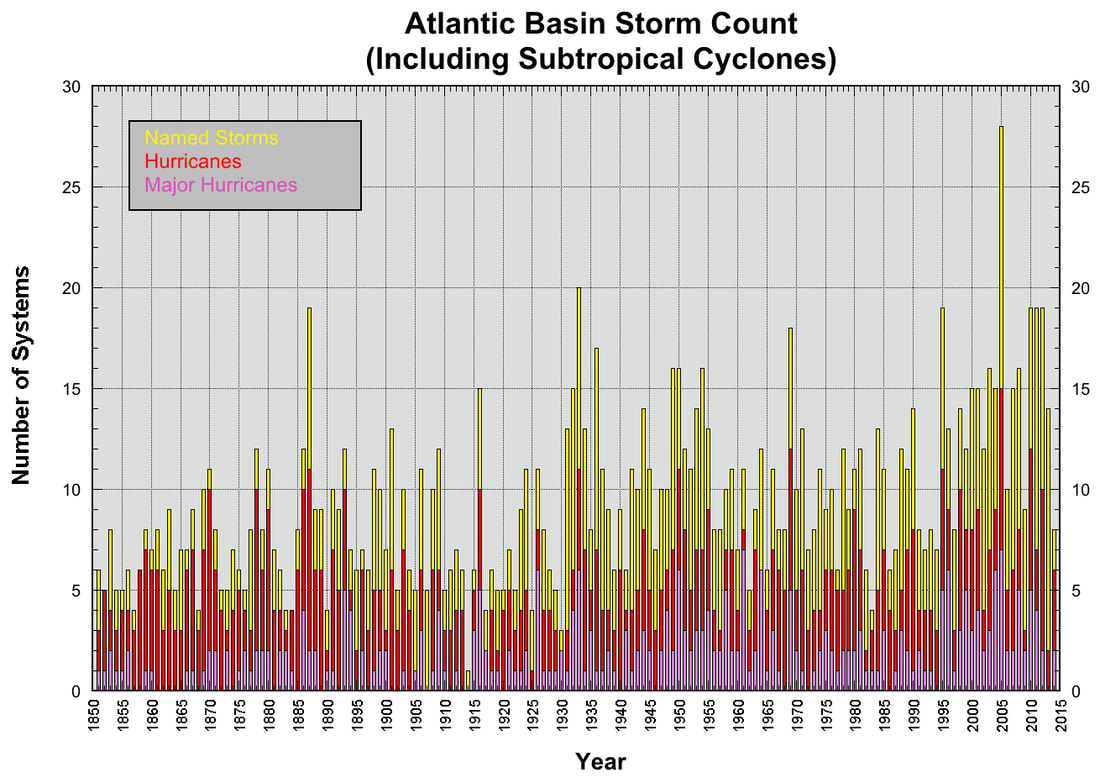 Named storms (yellow), hurricanes (red), and major hurricanes with sustained winds above 130 mph (purple) in the Atlantic basin, 1850-2015. Not depicted: the record-breaking 2017 hurricane season. Source: NOAA National Hurricane Center. Climate changes and the local environment:Haiti is a country prone to extreme weather: floods, droughts, and especially hurricanes. Typically, hurricanes make landfall on the southern coast of Haiti, and as a result communities located there experience the greatest storm surges. The largest city on a south-facing coastline is the commune of Gonaïves. The frequency of Atlantic hurricanes has increased sharply since the 1980s, and seems to have risen overall since the 19th century. However, it is hard to determine exactly how many hurricanes churned through the Atlantic before the widespread use of weather satellites. Our understanding of long-term trends in hurricane frequency may therefore be skewed by early underreporting of remote or short-lived hurricanes. Still, it seems clear that major hurricanes in particular have grown more common as sea surface temperatures warm across the Atlantic, and particularly in the Caribbean Sea. Hurricanes are fueled by warm, moist air rising from warm water. The warmer the water, the more fuel hurricanes can use. The most powerful hurricanes, with sustained winds at or above 130 mph (209 km/h), have rarely made landfall in Haiti. Category 5 hurricane Irma, for example, only lightly grazed northern Haiti. Yet substantial hurricanes have recently made made landfall in Haiti and caused catastrophic flooding in Gonaïves. Moreover, hurricane storm surges are higher now than they once were, owing in part to a modest but sustained increase sea levels on the Haitian coast. Hurricane floods have also been slow to recede from Gonaïves, owing to surrounding mountains that trap water within the commune. Long-lasting floods have raised the salinity of soil and groundwater around Gonaïves, and have thereby repeatedly hindered rice cultivation. Meanwhile, deforestation on and around the mountains near Gonaïves has led to mudslides amid torrential rainfall during and after hurricanes. 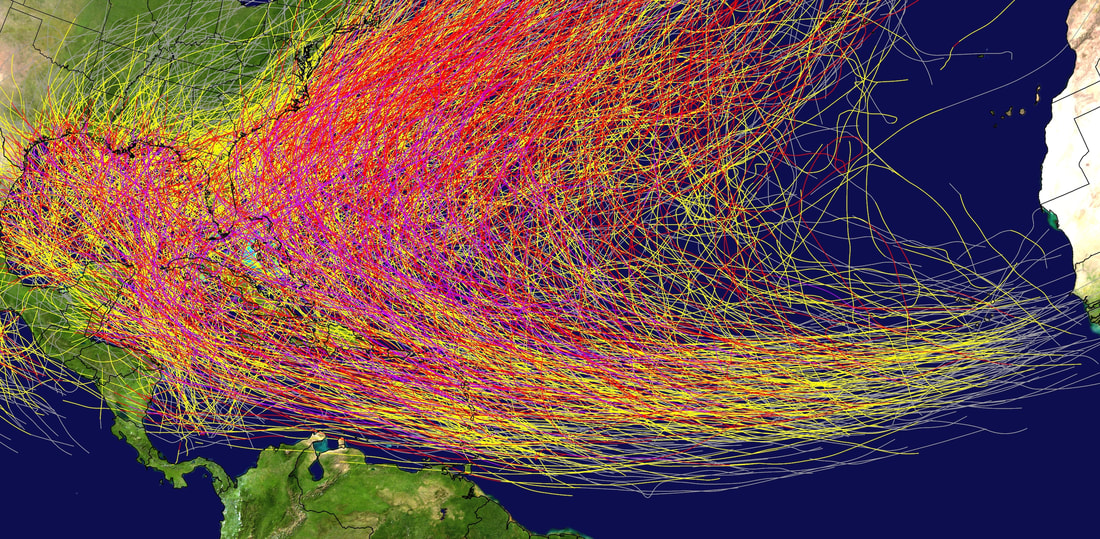 Storm tracks of recorded North Atlantic tropical cyclones, 1851-2015. Grey lines depict tropical depressions, yellow lines tropical storms, red lines hurricanes, and purple lines major hurricanes with sustained winds at or above 130 mph. Source: NOAA National Hurricane Center. How we know:This summary makes use of reconstructions compiled by the National Oceanic and Atmospheric Administration (NOAA) National Hurricane Center, which provides easy to use visualizations that record the history of hurricanes in the Atlantic Basin. It also draws on an overview of changes in hurricane frequency provided within the U.S. National Climate Assessment, and a skeptical assessment of hurricane trends published by the NOAA Geophysical Fluid Dynamics Laboratory. Human consequences:Haiti today is almost entirely deforested, and that has greatly increased the vulnerability of its coastal cities to hurricanes. Beginning in the seventeenth century, European settlers imported slaves from Africa to work in plantations that destroyed much of the indigenous forest of the island of Hispaniola, which includes Haiti. Late in the twentieth century, impoverished Haitians destroyed almost all the forests that remained in order to exploit charcoal. With oil and coal too expensive for most Haitians to afford, charcoal provided one of the few accessible sources of fuel. Exposed hillsides now offer no resistance to floodwaters, and easily crumble in devastating mudslides. Meanwhile, nearly all of Haiti's watersheds are deforested. In this context, active hurricane seasons can provoke human suffering on a vast scale across Haiti, and those seasons have grown more common. In 2004, for example, Hurricane Jeane dropped 13 inches of rain on the northern mountains of Haiti and caused catastrophic flooding in and around Gonaïves. Nearly 3,000 Haitians lost their lives. In 2008, no fewer than four hurricanes made landfall in Haiti. Floods were particularly devastating in Gonaïves, but overall houses belonging to nearly 800,000 Haitians were either damaged or destroyed. Floods swept away roughly 70% of Haiti's crops and thereby provoked widespread hunger and malnutrition. Festering flood waters provided ideal conditions for the spread of cholera, malaria, and West Nile disease. In 2016, Hurricane Matthew, a major category 4 storm, devastated southern Haiti and killed over 900 people. Haitians have not remained passive in the face of these challenges. Recently, the Haitian government has partnered with international aid groups and celebrities to launch a major reforestation program. International efforts, meanwhile, aim at reducing social and gender inequality across Haiti, and thereby fostering resilience to climate change in communities such as Gonaïves. Article author: Armelle Déjoie, Georgetown University
Article editor: Dr. Dagomar Degroot, Georgetown University 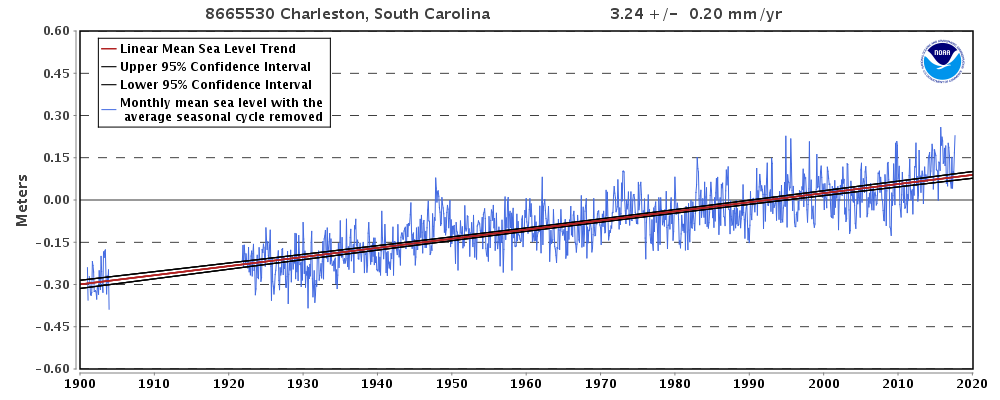 Sea levels off Charleston, 1901-2016. Source: NOAA Tides and Currents. Climate changes and the local environment:Mean global sea levels have risen by at least 17 cm (nearly 7 inches) in the twentieth century. Yet regional variations in ocean temperatures, prevailing winds, ocean currents, and the rise or fall of Earth's crust mean some areas have experienced, and will experience, greater sea level increases than others. Over the past century, sea levels of Charleston, South Carolina have risen by nearly one foot (30 cm, or 12 inches), and have increased by an average of 3.2 mm per year. In recent decades, rising sea levels have sharply increased the risk of flooding in Charleston during periods of heavy rain. Average annual precipitation has increased only modestly in Charleston, but rainstorms have grown significantly more common. As sea levels climbed, floodplains have also increased in size, meaning that more people and property each year became vulnerable to flooding. Nuisance flooding, or flooding from high tides without a storm, is four times more common in Charleston today than it was in 1950. Meanwhile, hurricanes and tropical storms have grown more powerful and more capable of causing catastrophic flooding when they make landfall. From 1975-1989, roughly 20% of hurricane strengthened to category 4 or 5, with winds at or above 130 mph (209 km/h). From 1990-2004, the share that reached at least category 4 had increased to 25%. Hurricanes are fueled by warm, moist air rising from warm water. The warmer the water, the more fuel hurricanes can use. In recent years, sea surface temperatures have provided ample fuel for hurricanes that ultimately made landfall in South Carolina. Hurricane Matthew made landfall in 2016, and hurricane Irma reached Charleston as a tropical storm in 2017. Though much weakened from the historic intensity it reached in Caribbean, Irma brought a high tide of nearly 10 feet to Charleston, which sent flood waters cascading into the city. 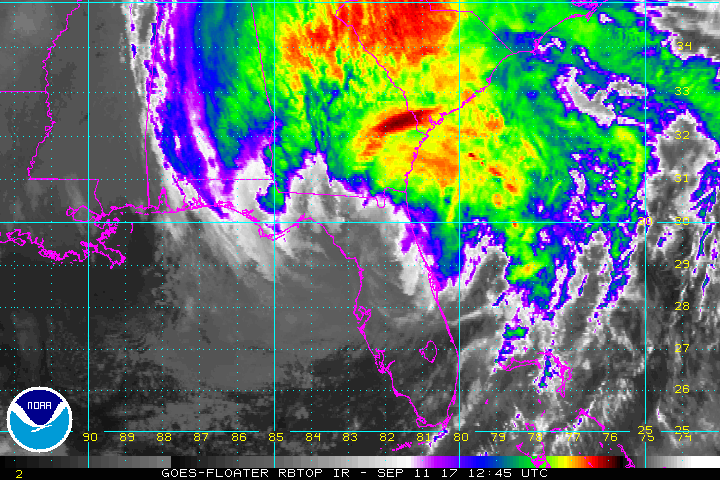 Tropical storm Irma hits Charleston in 2017. Source: NOAA Geostationary Satellite Server. How we know:This information draws on a National Oceanic and Atmospheric Administration (NOAA) study that connects global warming and hurricanes, and a widely-cited 2006 study in the journal Science that reconstructs changes in the frequency of the most powerful tropical cyclones. It also makes use of reliable, easy to use tools that are freely available online: the the NOAA Climate at a Glance app, and the NOAA Tides and Currents resource. The Climate at a Glance tool uses data collected at weather stations and stored in NOAA's U.S. Climate Divisions database. The Tides and Currents tool reconstructs sea level trends using measurements from U.S. and Global Stations, screening out regular seasonal fluctuations due to coastal ocean temperatures, salinities, winds, atmospheric pressures, and ocean currents. 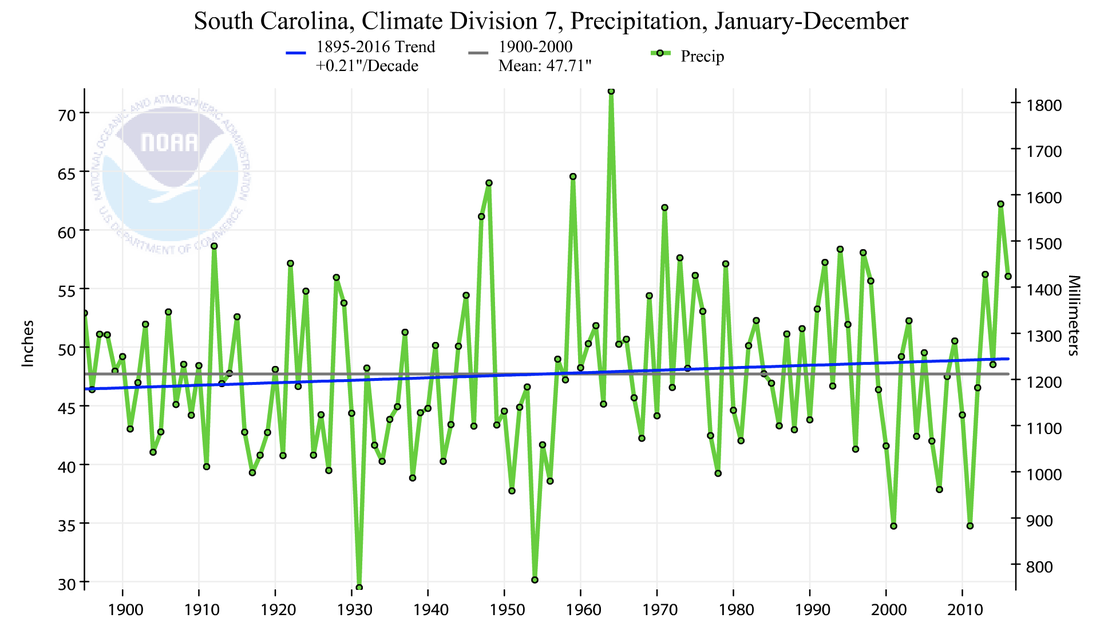 Average annual rainfall in southern South Carolina, relative to a twentieth-century base period, showing a modest upward trend. Source: NOAA Climate at a Glance. Human consequences:Tropical storms and hurricanes have crippled coastal cities like Charleston. In 1989, for example, hurricane Hugo swept ashore in South Carolina as a category 4 storm. It was fast-moving, and it therefore dropped only a relatively modest amount of rain. Yet its power resulted in a storm surge that reached 20 feet in some stretches of the South Carolina coast. Sustained winds in downtown Charleston reached 87 mph (140 km/h), but gusts exceeded 108 mph (174 km/h). The wind and water destroyed rows of beach houses, shattered docked boats, and collapsed part of the Ben Sawyer Bridge. The storm caused nearly $12 billion (2017 USD) in damage and directly or indirectly resulted in 35 deaths across South Carolina. In 2017, Irma sent roughly 4 feet of ocean water spilling into downtown Charleston and caused the worst flooding in the city since Hugo made landfall. Since residents had not been ordered to evacuate, many were caught off guard by the flooding, and some needed rescuing. Irma was the costliest storm to reach Charleston since Hugo, and caused well over $1 billion in damage across South Carolina. 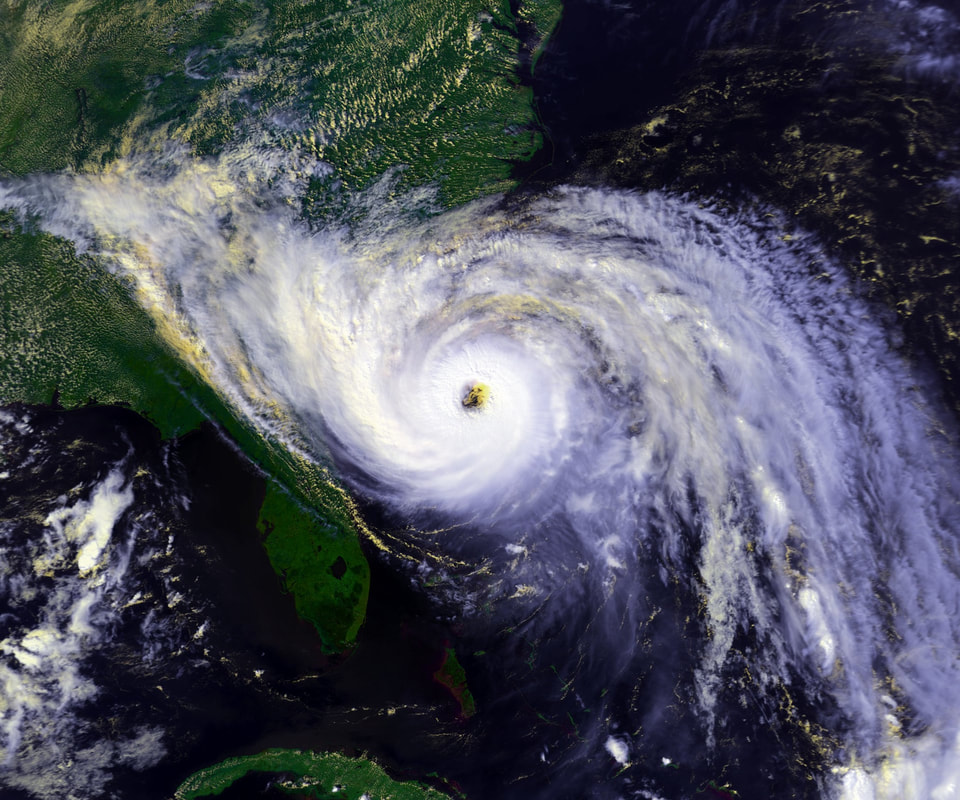 Hurricane Hugo bears down on South Carolina in 1989. Source: NOAA-11. Less damaging but far more common nuisance floods have also imposed high costs on coastal communities across South Carolina, including Charleston. Tidal floods have inundated and therefore closed roads, and even modest floods have damaged vehicles exposed to the salty water. Heavy rain, meanwhile, has repeatedly caused flooding that drainage systems can only gradually alleviate. Since 1990, taxpayers in Charleston have spent over $238 million to repair drainage systems damaged by tidewater. The worst flooding in Charleston has occurred in former marshes that once provided protection from rising waters but have now been filled in for development. Particularly at risk areas are actually sinking relative to the sea, since many were built on soil deposited by bulldozers that has grown more compact with time. Efforts have been made to stabilize beach houses and "renourish" beaches, which involves expanding beaches with sand from other sources. These ongoing initiatives have fortified at least some of the South Carolina coast in the face of rising seas. Further reading:The Front Lines of Climate Change: Charleston’s Struggle. Climate Central Your Post-Storm Update: Charleston Assesses Irma's Damage. The Post and Courier Article author: Kevin Berning, Georgetown University
Article editor: Dr. Dagomar Degroot, Georgetown University 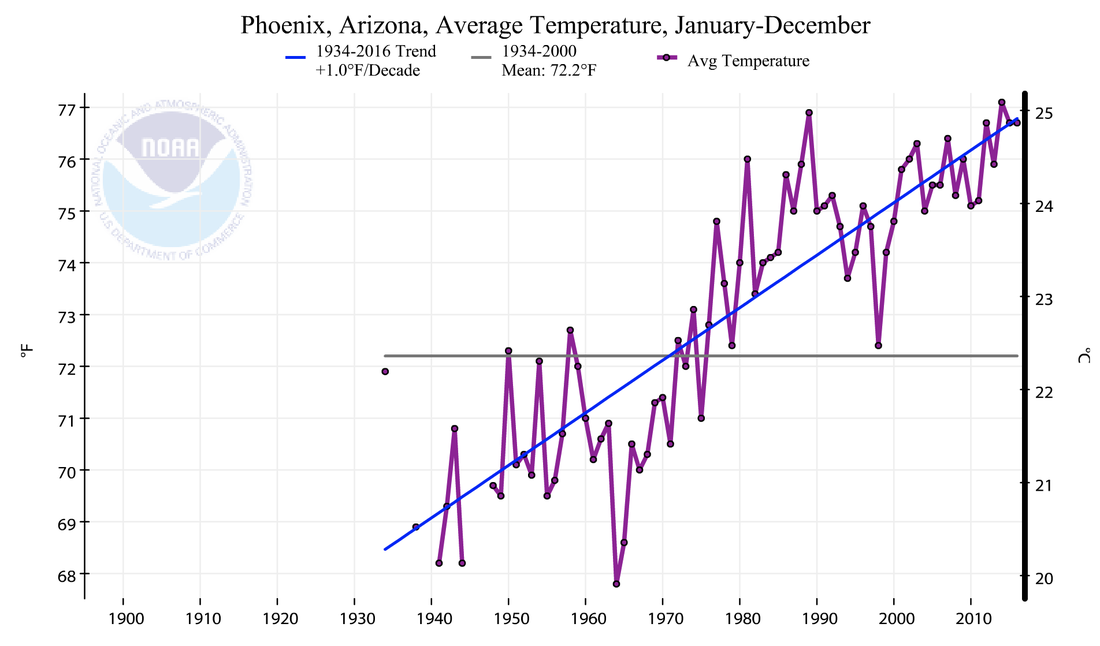 Average annual temperatures in Phoenix, the county seat of Maricopa County, 1935-2017. Source: NOAA Climate at a Glance. Climate changes and the local environment:Since 1970, average annual temperatures in Arizona have soared. In densely-populated Maricopa County, which includes Phoenix, average annual temperatures have risen by over 7° F (nearly 4° C), which is roughly four times the global average. In no major U.S. city have temperatures climbed more quickly. This remarkable rise has sharply increased the frequency of particularly extreme weather. In the summer of 2017, for example, a heat wave sent temperatures soaring to over 120° F (nearly 50° C). Summer days with relatively cool temperatures, by contrast, have grown scarce. From June to September 2017, only 14 days had high temperatures lower than 100° F. Higher temperatures have increased rates of evaporation across Arizona, and therefore dried much of the state. Average annual precipitation in Maricopa County has actually increased slightly over the past century, yet precipitation in mid to late summer has declined substantially. Summer droughts have therefore become common in Maricopa County. Warming, drying trends have created ideal conditions for wildfires across Arizona, including in Maricopa County. Wildfires in Arizona have therefore grown more frequent, and they last longer. In spring 2017, a wildfire in Maricopa County’s Tonto National Forest consumed some 500 acres of woodland. 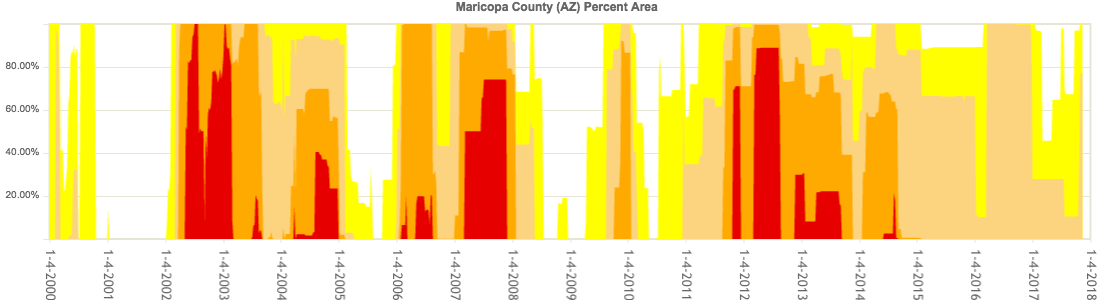 Drought severity in Maricopa from 2000 until 2017. Darker colors represent worse droughts; higher values mean more of the county was in drought. Source: United States Drought Monitor. How we know:These reconstructions are largely based on reliable, easy to use tools that are freely accessible online: the National Oceanic and Atmospheric Administration (NOAA) State Annual and Seasonal Time Series, the NOAA Climate at a Glance app, the National Drought Mitigation Center's United States Drought Monitor. NOAA's State Annual and Seasonal Time Series and Climate at a Glance tools use data collected at weather stations and stored in NOAA's U.S. Climate Divisions database. The Drought Monitor compiles weekly maps of drought conditions across the United States, and combines climate, soil, and water data with reports from 350 experts across the country. 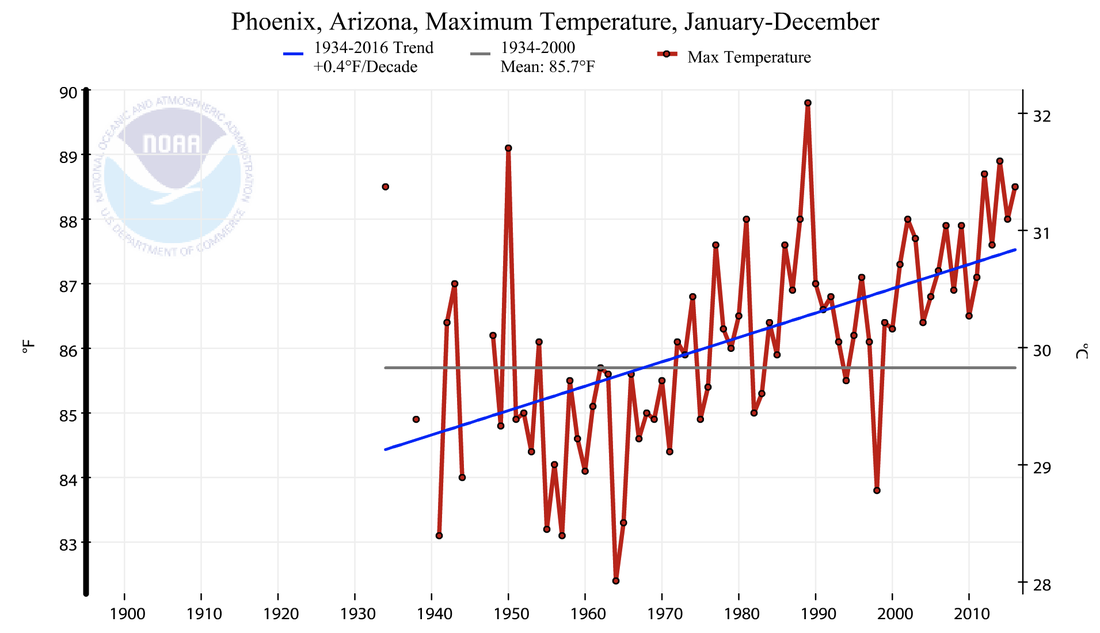 Average daily maximum air temperature in Phoenix, 1934-2017. Source: NOAA Climate at a Glance. Human consequences:Rising summer temperatures in Arizona have increased the number of heat-related deaths in Maricopa County. Especially hot, dry weather can provoke dehydration and heat stroke, and can interfere with cardiovascular, respiratory, and nervous systems. The very old, the very young, and the sick are especially vulnerable, particularly in poor neighborhoods where some households might not have dependable access to air conditioning. Employees who spend most of their time outside - such as construction workers - are also at risk. Heat-related threats to human health can be especially great in cities like Phoenix, where paved surfaces create urban heat sinks that amplify hot temperatures. In 2016, Maricopa County endured 130 heat-related deaths, the most in the last 15 years. On average, Arizona hospitals now treat almost 2,000 patients per year for heat-related illnesses. Many injuries and deaths not only reflect warming trends, but also social and infrastructural problems that make it hard for people to escape the heat. Wildfires in Arizona, including in Maricopa County, have also proven costly for state and federal governments. Containing the Arizona wildfires has cost many millions of dollars, and the total costs of wildfires can exceed suppression costs by more than 30 times. In Maricopa County, smoke billowing from fires in Tonto National Forest, for example, shut down Bush Highway. Foresters have conducted controlled burns to limit the future risk of major wildfires in the forest, but prolonged drought has foiled some of these efforts. In Phoenix, the municipal government has taken steps to lower the city's contribution to climate change. It has expanded public transit, constructed new bike lanes, purchased electric vehicles, installed low-energy bulbs in street lighting, and set ambitious goals for cutting greenhouse gas emissions. Still, adapting to climate change has proven to be an even more daunting task, especially for the city's less affluent residents. Further reading:A Building Boom and Climate Change Create an Even Hotter, Drier Phoenix. LA Times Phoenix Will Be Almost Unlivable by 2050 Thanks to Climate Change. Vice Article author: Luke Powers, Georgetown University
Article editor: Dr. Dagomar Degroot, Georgetown University 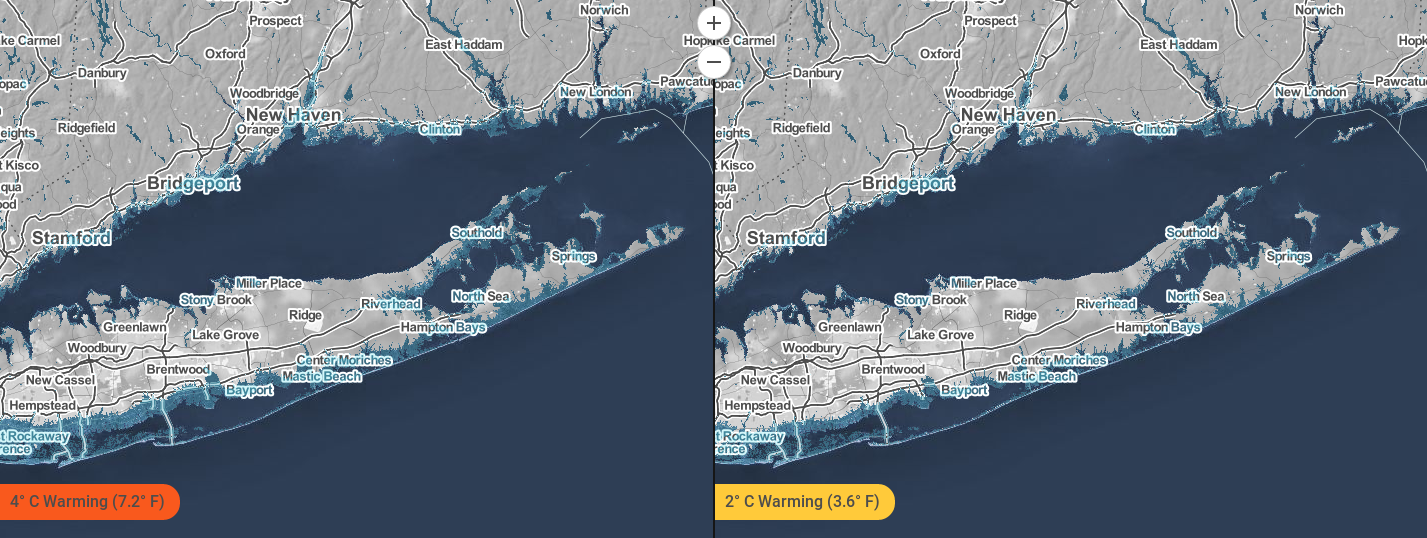 Changes to the Suffolk County coastline under two different emissions scenarios. Source: Climate Central Surging Seas: Mapping Choices. Climate changes and the local environment:As global sea levels rise, regional variations in ocean temperatures, prevailing winds, ocean currents, and the rise or fall of Earth's crust mean that some communities have experienced, and will experience, greater sea level increases than others. Sea levels off Suffolk County, Long Island, for example, are rising at a rate of around 3.23 mm/year, which is up from 2.78 mm/year just one decade ago. New York State is in fact sinking relative to the sea, owing to a combination of human activity and the slow rebound of the landscape following the retreat of the great glaciers that covered the state during the last ice age. Meanwhile, the melting of polar ice sheets and the warming of Earth's oceans mean that seal levels off the state are projected to increase steadily. If emissions of greenhouse gases continue unabated, and average global temperatures rise by around 4° C (roughly 7° F) relative to twentieth-century averages, then the entire southern coast of Long Island, including that of Suffolk County, will eventually be inundated. Montauk, the tip of Suffolk County, will then become its own island, separated from Long Island by a chasm of water. Winters, meanwhile, are expected to grow shorter but wetter, and major storms - such as Superstorm Sandy - are projected to grow more common. Storm surges will likely threaten natural defenses against the sea, including saltwater marshes and dunes, in ways that may permit even more extensive flooding. 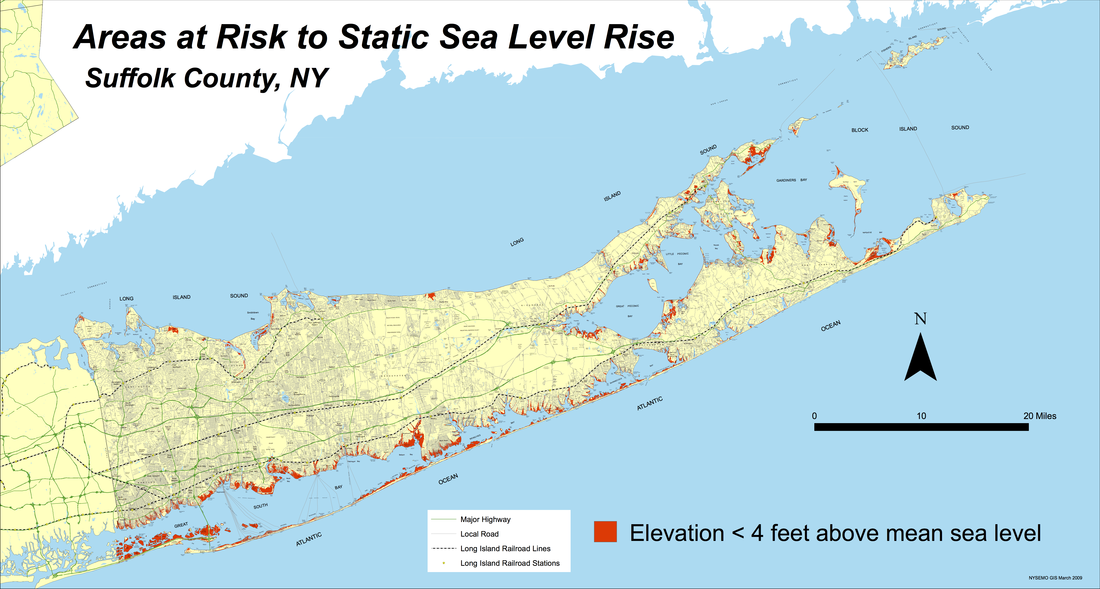 Areas in red are less than four feet above sea level, and are already highly vulnerable to flooding in major storms. Source: Department of Environmental Conservation, New York State. How we know:These projections and reconstructions are largely based on reliable, easy to use tools that are freely accessible online: the National Oceanic and Atmospheric Administration (NOAA) Sea Level Trends app, the NOAA Climate Explorer app, and the Climate Central Surging Seas, Mapping Choices app. The Sea Level Trends tool shows regional mean sea level changes from the twentieth century through today. NOAA collects data for these measurements through the 142 long-term tide stations of the National Water Level Observation Network, which has been measuring sea level for over 150 years. Each regional mean sea level rise or fall is computed using a minimum of 30 years of data to ensure accuracy. The Climate Explorer tool uses weather information recorded by meteorological instruments at weather stations to reconstruct past climate changes. It uses supercomputer simulations of future climate changes under both high and low emissions scenarios. The Surging Seas tool combines historic flood statistics and local sea level trends with global scenarios of sea level increases, which were compiled in the 2014 U.S. National Climate Assessment. These projections also make use of a map designed by the New York State Department of Environmental Conservation, which shows the extent of low-lying coastal areas around Suffolk County. 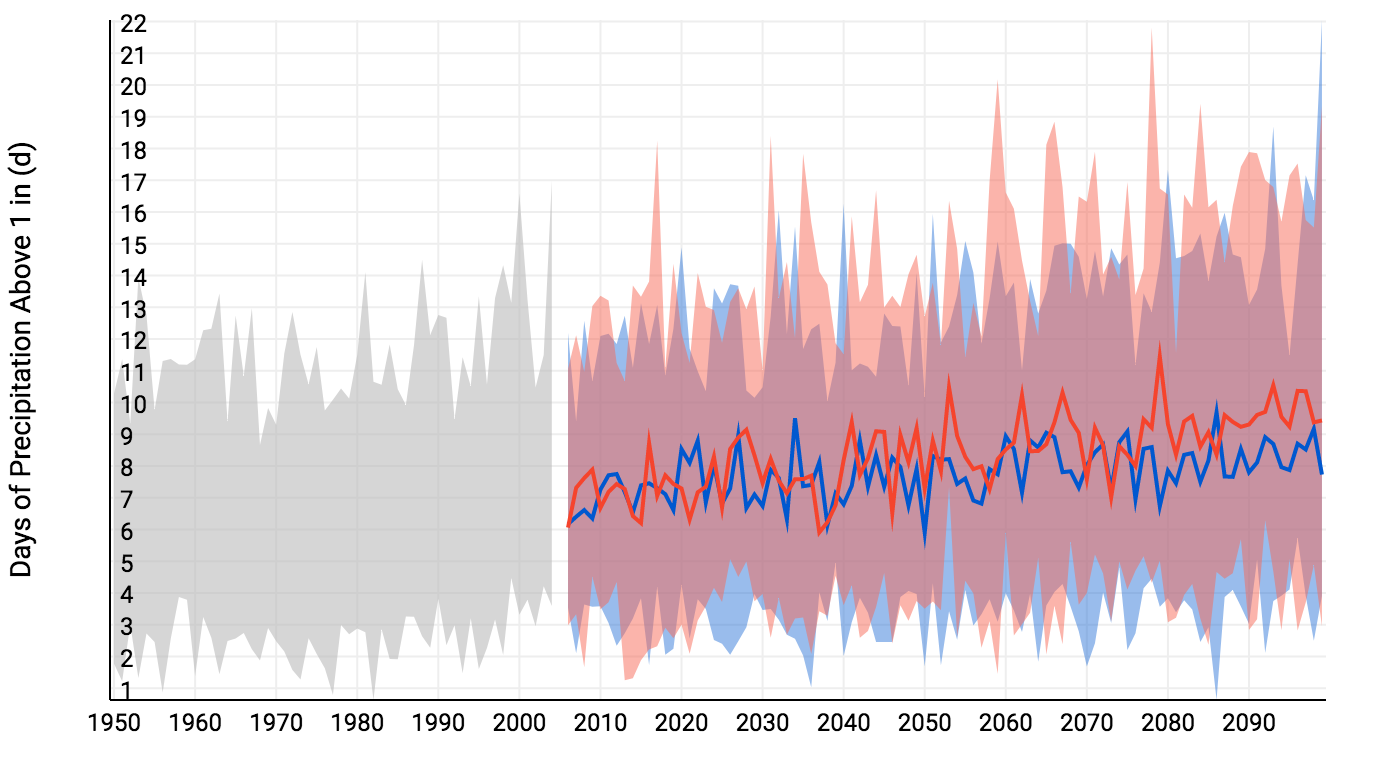 Modeled days of extreme precipitation in Suffolk County, up to 2100. Much of the projected increase involves winter precipitation. Red shows the projection for a future with higher emissions, and blue with lower emissions. Source: NOAA U.S. Climate Resilience Toolkit (Climate Explorer). New York State is the third largest coastal flooding threat in the United States, and in 2008 it was reported that about 13.9 percent of the state's residents live directly on the coast. Many towns in Suffolk, particularly some of those located on the southern border, are precariously close to the sea. Even in scenarios that assume drastic action to curb human-caused greenhouse gas emissions, many of these towns will be underwater. Well before that happens, rising sea levels and intensifying storms will batter coastal infrastructure. Today, warming sea surface temperatures are already undermining the quality of local drinking water, and the health of coastal ecosystems, by creating ideal conditions for toxic bacteria. Wetlands that help filter pollution from water flowing out to sea, meanwhile, are vulnerable to rising sea levels and intensifying storms. Further inland, rising temperatures will encourage the spread of pollen, ragweed, and poison ivy, will creating more favorable conditions for Lyme disease. Suffolk County, in short, is set to become a far less healthy place for its inhabitants and the ecosystems on which they depend. In response, municipal, state, and federal governments have mobilized to shore up flood defenses - such as coastal dunes - while some county residents have elevated their coastal homes and businesses. In the long run, however, coastal areas of the county will either need to be protected using very expensive defenses against the sea, or evacuated to make way for the rising waters. Read more:Climate Change Could Threaten Long Island. The Weather Channel Coastline Population Trends in the United States: 1960 to 2008. US Census Bureau Article author: Isabel Paret, Georgetown University
Article editor: Dr. Dagomar Degroot, Georgetown University 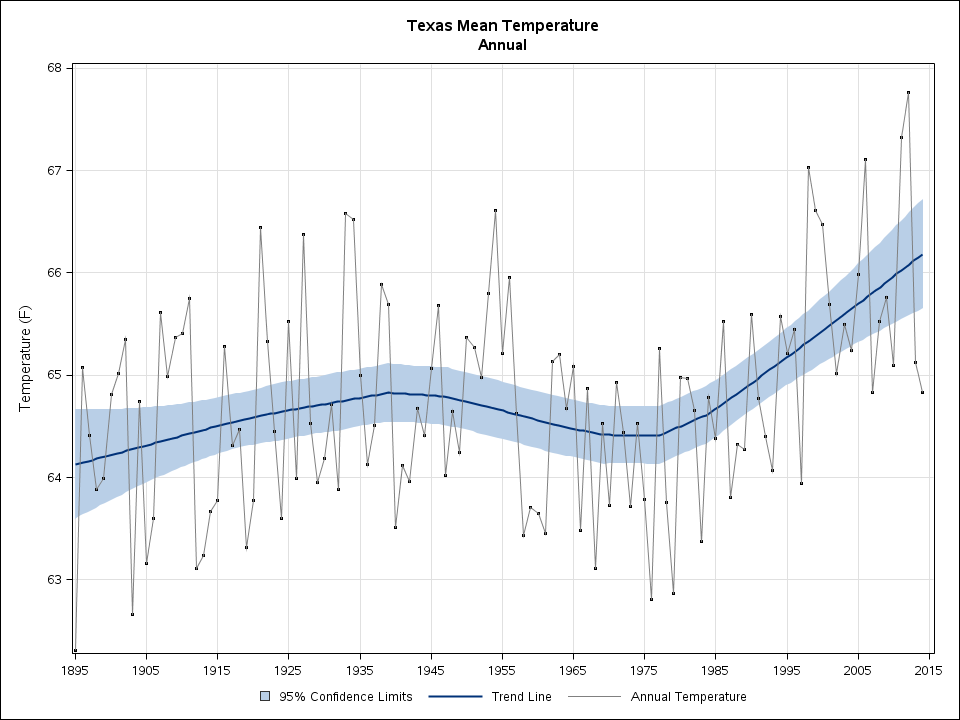 Mean annual temperatures in Texas since 1895. Source: NOAA State Annual and Seasonal Time Series. Climate changes and the local environment:For decades, global warming has increased sea levels in most coastal regions. Glacial meltwater has poured into the oceans, while warming water has expanded, taking up more volume and therefore sending sea levels ever higher. Communities at risk of major tropical cyclones - such as Galveston county, Texas - have faced the full consequences of these changes to the world's oceans. Hurricanes are fueled by warm, moist air rising from warm water. The warmer the water, the more fuel hurricanes can use. While global warming has likely not increased the frequency of hurricanes overall, it has increased the frequency of exceptionally severe storms. Currently, powerful hurricanes are up to 11% stronger and more dangerous for communities such as Galveston. A hurricane's winds usually cause the greatest damage to human infrastructure by pushing ashore enormous quantities of water. These "storm surges" are highest in powerful hurricanes, which means that they are more frequently destructive now than they have been. Off Texas, rising sea levels have made them even worse. Between 1957 and 2011, sea levels off Galveston rose by just over a foot, which has greatly increased the damage that will be inflicted to the county in a major hurricane. 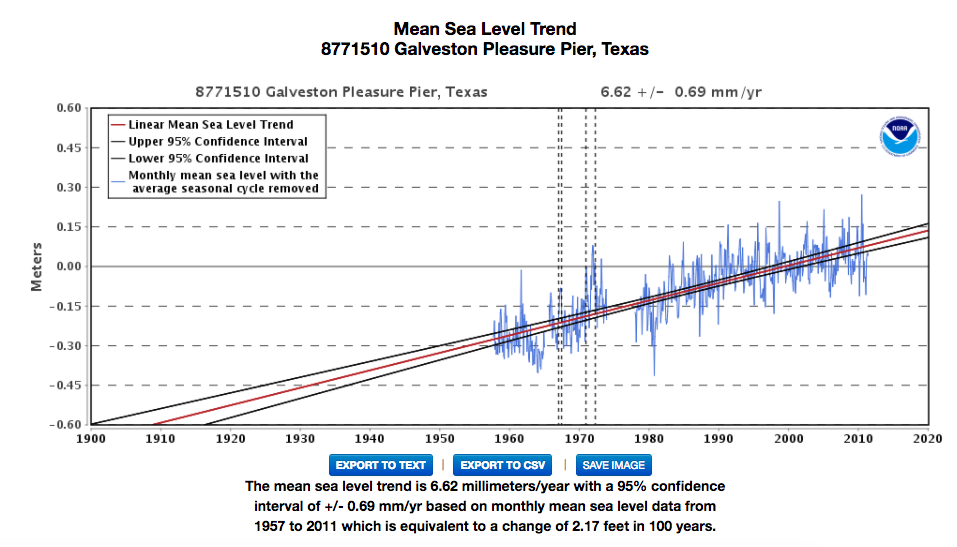 Sea levels off of Galveston, Texas, 1957-2011. Source: NOAA Tides and Currents. How we know:This information is derived from the National Oceanic and Atmospheric Administration (NOAA) study that connects global warming and hurricanes. It also draws from easy to use tools that are available online: the NOAA State Annual and Seasonal Time Series, and the NOAA Tides and Currents resource. NOAA’s GFDL study on Global Warming and Hurricanes pulls data from published articles regarding hurricane intensity and temperature fluctuations since the 1800s. NOAA’s State Annual and Seasonal Time Series is derived from the current U.S. Climate Division Database that pulls data from temperature stations. NOAA’s Tides and Currents produces sea level trends measured from U.S. and Global Stations without the regular seasonal fluctuations due to coastal ocean temperatures, salinities, winds, atmospheric pressures, and ocean currents. 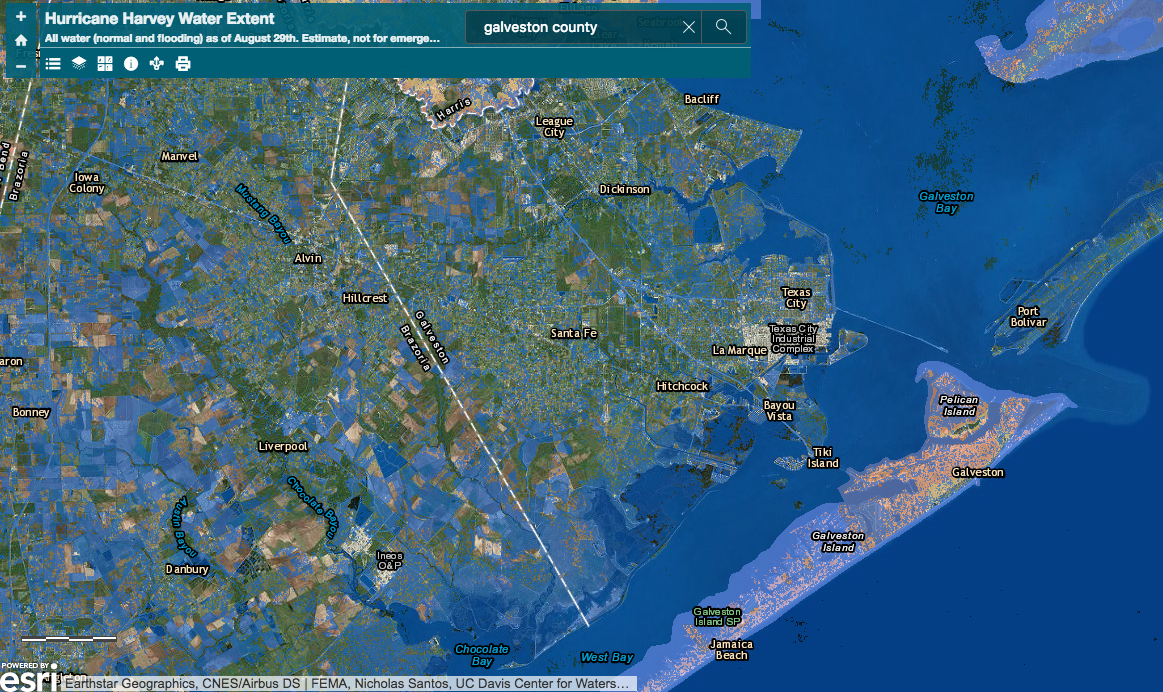 Flooding in Galveston during Hurricane Harvey. Source: UC Davis Center for Watershed Sciences Hurricane Harvey Water Extent Geographic. Human consequences:Galveston became a major U.S. commercial center and one of the largest ports in America during the 19th century. Whenever a major hurricane hits the county, its lack of a sustainable drainage system leaves many of its streets inundated with water for weeks. Without adequate flood safety measures, today 320,000 people are forced to evacuate from their homes at the approach of a hurricane. When these people are displaced and Galveston’s port is flooded, millions of dollars in goods from the commercial port are lost. Thousands of businesses around the United States that receive imported materials through this port are also impacted. Because Galveston County has long had a major commercial port, it has a great deal of infrastructure that is vulnerable to hurricanes. In 1900, it endured the deadliest natural disaster in American history, when the 15-foot storm surge of the Galveston Hurricane killed up to 12,000 people. In 1970, Hurricane Celia, a Category 4 storm, came ashore near Galveston and inflicted nearly $6 billion of damage in 2017 USD. Then, in 2017, Hurricane Harvey inflicted $23 billion worth of property damage in Harris and Galveston counties alone. Galveston County is extremely vulnerable to intense hurricanes, increasing local temperatures, and rising sea levels. As hurricanes strengthen and sea levels rise, the county may be hard pressed to survive the twenty-first century. Further reading:Article author: Kiera McCrane, Georgetown University
Article editor: Dr. Dagomar Degroot, Georgetown University  Mean annual temperatures in Arizona since 1895. Source: NOAA State Annual and Seasonal Time Series. Climate changes and the local environment:Mohave County is located in Northwestern Arizona, and includes part of the Grand Canyon National Park, as well as several federally recognized Native American Reservations. Its annual average temperatures have risen by an average of 0.2°F per decade between 1895 and 2016. However, this average hides the fact that average temperatures in the county and the state were mostly stable until roughly 1975. After that year, the trend in average temperatures began rising very quickly, and this caused a worrying increase in the frequency and intensity of wildfires and droughts. These weather and climate-related events have had devastating effects in the local environment. As much as 15 per cent of Arizona is covered by national forests, and the hotter and drier conditions have made it easier for wildfires to occur. According to U.S. Forest Service records, large wildfires (of more than 1,000 acres) in the state have increased from approximately 5 per year before 1980, to a current average of near 20. Drought has affected the Colorado river, a source of water for over 30 million people, including a large share of Mohave County and the State of Arizona. For example, the Upper Colorado Basin has seen more common and severe droughts in the last 50 to 90 years. In the period between 2000 and 2014, the river’s flow declined by 19 per cent compared to the average between 1906 and 1999. Researchers have estimated that warmer temperatures account for up to one-sixth of these losses, which are approximately equal to enough water to support 1 million households for a year.  Since the 1990s, Lake Havasu City, a city in Mohave County that borders with Southern California, has seen average temperatures in August that are much higher than the long-term average for that month. Source: NOAA. How we know:These climate and weather reconstructions are based on several tools made available online by several United States agencies, such as the National Oceanic and Atmospheric Administration (NOAA)’s State Annual and Seasonal Time Series. This site is useful to see the evolution of temperatures at the state level since 1895, and its information is obtained from the U.S. Climate Divisional Dataset, used often for agricultural matters. NOAA’s Climate at a Glance tool is intended for studying the changes and variability of climate, and has adjusted the data to take into account artificial effects that affect climate, such as urbanization. Another important resource is the United States Drought Monitor, which develops weekly maps of drought conditions across the country, and uses climate, soil, and water data, together with reports from 350 experts across the country. The U.S. Climate Resilience Toolkit helps people become informed about their risks and opportunities related to the changing climate, and to help them become more resilient. One of its tools is the Climate Explorer, which allows users to explore the potential damaging effects of climate on the population and their valued possessions, such as land and crops. To do this, it shows projections of temperatures, precipitation, and others for two possible futures: one in which humans make a moderate attempt to reduce their carbon emissions, and another in which humans continue to act as usual. 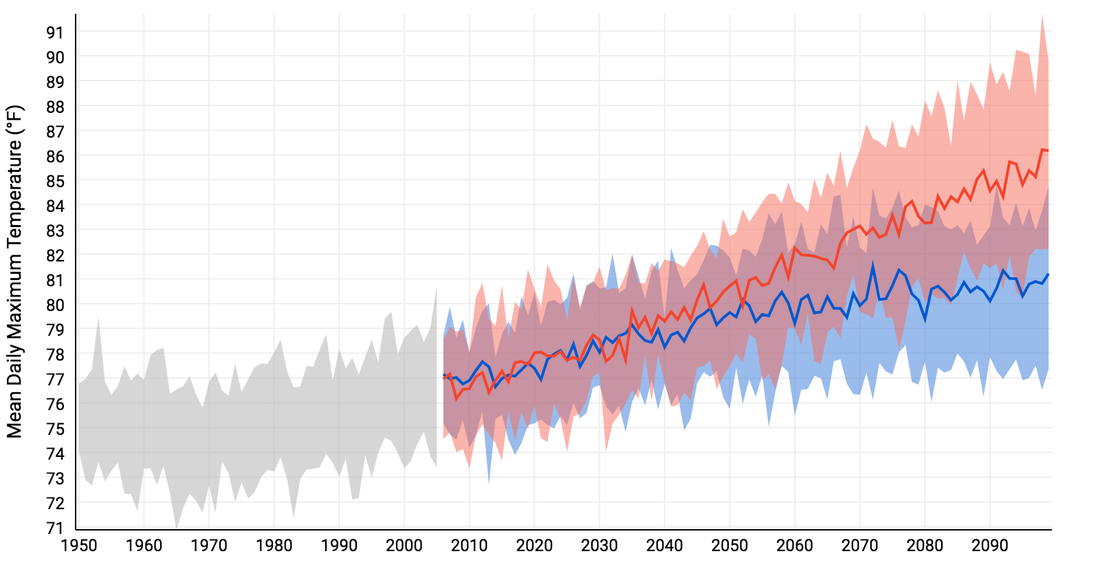 Average daily maximum temperatures in Mohave County, Arizona. Grey shows the historical trend since 1950. Red shows the projection for a future with higher emissions, and blue with lower emissions. Source: NOAA U.S. Climate Resilience Toolkit (Climate Explorer). Some of the biggest effects of climate change in Arizona have been linked to health concerns, disruptions in the water supply for farms and cities, and the destruction of the environment with wildfires. In the summer of 2017, the state made nationwide news when numerous flights were cancelled in Phoenix due the excessive heat. These extreme temperatures caused near 1,300 deaths between 2005 and 2015, and the number of heat-related illnesses has been increasing, according to a medical director at the Banner University Medical Center in Phoenix. The Environmental Protection Agency (EPA) has reported that more than 2 per cent of the land in Arizona has burned per decade since 1984, and the smoke produced often damages the quality of the air and water, and creates health problems for the population. In Mohave County, the most significant human consequences of climate change can be found in the water supply disruption to households, and in the Native American communities. Decreasing water reserves in important bodies of water like Lake Mead, and the increasing water needs due to growing cities and new farms that move from California’s even more extreme water shortage, have led to severe concerns and restrictions on water use. Native American tribes have seen their traditional practices challenged, as they are typically very dependent on agriculture and the raising of livestock, which in turn depend on weather and the availability of water. For the Mohave tribe, a drier Colorado River means a disruption to their traditions, as they believe that the river was created by their ancient deity Mastamho as part of their sacred landscape. Despite this worrisome picture, in a Climate Central report, Arizona’s government received a failing grade for its average level of wildfire preparedness, and a near-failing grade for its drought preparedness, as its plans do not account for the devastating effects of climate change. Further reading:The Future is Drying Up. NY Times Magazine Where the River Runs Dry. The New Yorker The $2.4 Billion Plan to Water California by Draining the Mojave. Wired Wildfires, Once Confined to a Season, Burn Earlier and Longer. NY Times Article author: Alejandro Carrera Rodriguez, Georgetown University
Article editor: Dr. Dagomar Degroot, Georgetown University |
 RSS Feed