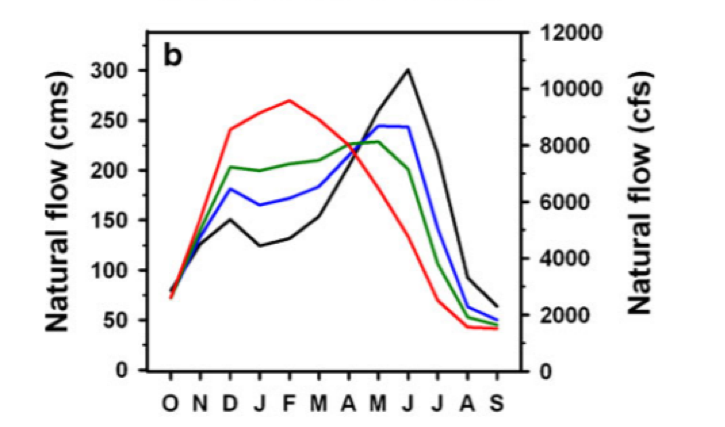
 Predicted waterflow of Yakima river, October to September. Black = historic average, Blue = 2020 – 2040, Red = 2080. Source: Vano et al., “Climate Change Impacts on Water Management and Irrigated Agriculture in the Yakima River Basin, Washington, USA.” Climatic Change 102, No. 1 (2010): 287–317. https://doi.org/10.1007/s10584-010-9856-z. Climate changes and the local environment: For Yakima county located in central Washington, the effects of climate change include both higher temperatures and an increased risk of drought. Yakima is in a Mediterranean climate similar to the climate of Greece and California. This climate is characterized by mild winters and hot summers; most precipitation – an average of 8.3 inches in Yakima – falls in the winter instead of the summer. Already hot, Yakima is expected to get hotter. Analysis by NOAA suggests that even in a “low emission” scenario, the weighted-average daily maximum temperature will be 61.4 degrees Fahrenheit in 2080. With “high emissions,” this temperature will increase to 64.5 degrees Fahrenheit. There is a large difference between these temperatures and the 2000’s maximum daily temperature of 55.3 degrees Fahrenheit. Drought is more likely to occur because of climate change. A tributary of the Columbia River, the Yakima river starts in the Cascade mountains. Water from the Yakima river comes from five reservoirs run by the U.S. Bureau of Reclamation: Lake Keechelus, Lake Kachess, Lake Cle Elum, Rimrock Lake, and Bumping Lake. The total volume of these reservoirs is around one million acre-feet of water. Because of winter snowpack, these reservoirs can easily fill-up in the spring. Snowpack is essential for these reservoirs to remain full. Less snowpack, however, would result in lower water levels in the reservoirs which are more likely to remain empty as the dry summer months continue each year. 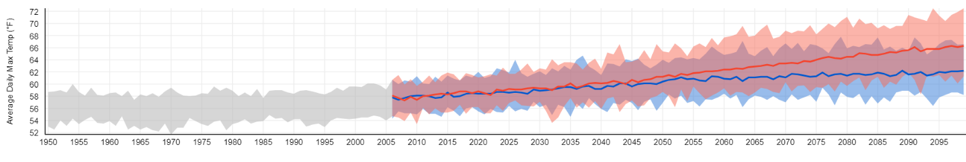 Average daily maximum temperatures predicted for Yakima county, 1950-2099: Grey - historically observed data to 2006 and similar conditions to 2099, Blue – lower emissions scenerio, Red – high emissions scenerio. Source: NOAA Climate Explorer. How we know: Data for rainfall was projected using a “variable infiltration capacity macroscale hydrology” model. One of the advantages of this simulation type is that scientists can use it to predict changes based not only on watersheds in Washington but based on other watersheds, that are out of the state, that could impact Washington’s water. This data was generated between 1916 and 2006, however it has been modified on each month to better reflect the changing climate that will occur 2020s, 2040s, 2080s via the delta method. Using the data from these simulations, scientists can evaluate both snowpack and streamflow. The “Snow Water Equivalent” graph below compares the predicted amount of water in a snowpack on April first in comparison to historical data. Additionally, projected and historical temperature data is supplemented from the National Oceanic and Atmospheric Administration (NOAA) climate explorer tool (National Oceanic and Atmospheric Administration 2020). This free, reliable, online tool gathers precipitation from on the ground metrological stations located both around the country and around the state. This tool predicts both scenarios with high greenhouse emissions, and low greenhouse emissions. 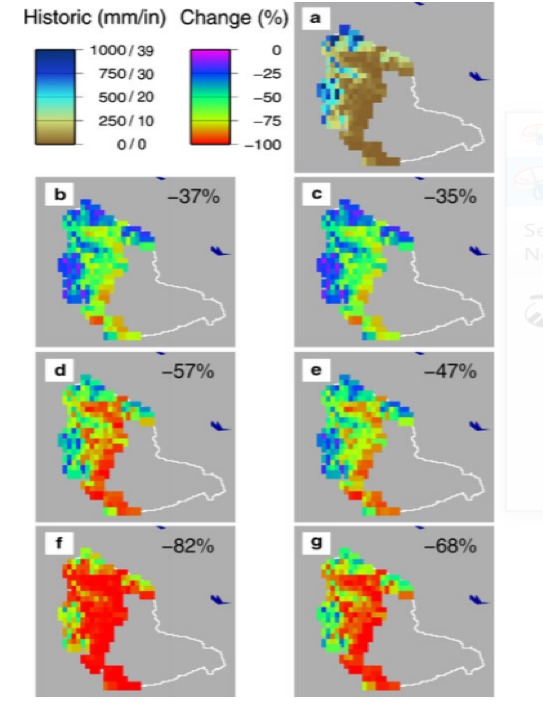 Predicted changed in Snow Water Equivalent in Yakima April 1st. a= Historical data, b&c= 2020s, d&e=2040s, f&g=2080s, A1B and B1 SRES models. Source: Elsner et al. Human consequences: Because Yakima gets so much sun, it is a center for agriculture with the highest market value from farming in the state. In addition to growing the most squash in the state, the county grows the most apples, cherries and pears. Furthermore, Yakima county produces more hops than any where else in the United States. In 2017, there were 2,952 farms in Yakima, with a combined total area of 1,781,463 acres. Ninety-six percent of these farms are family owned. The Yakima river basin is one of the most irrigated areas in the United States. Fifteen percent of farm area, or 260,023 acres, are irrigated through canals, many of which were built in the late nineteenth century. Yet, since 1977, the Yakima basin has experienced seven droughts, and numerous low water years. Climate change will only exacerbate these issues, droughts will become more frequent and more severe. As most of the precipitation shifts from snowpack to rain, there will be less water stored in reservoirs. Therefore, the Yakima river will have less streamflow. For farmers who get their water from the Yakima river, a drastically reduced flow will hamper growing efforts. In addition, the Yakima river provides crucial spawning and rearing habitat for several salmon species. Fish, of course, need water to survive. One study found that the spawning ground for Coho Salmon and Fall Chinook will decrease because of climate change. The Yakima Tribe of Indians has tribal water rights to protect fish in the Yakima river under an 1855 treaty, however these rights were vague. The famous Ecology v Acquavella et. al. case settled in 2019 established primary water rights for the Yakima nation and addressed instream flows necessary to maintain fish and other aquatic life. Further reading:Ecology v Acquavella - Washington State Department of Ecology. Yakima River Basin. USGS. Identifying Stakeholder-Relevant Climate Change Impacts: A Case Study in the Yakima River Basin. Climatic Change. Climate change impacts on water management and irrigated agriculture in the Yakima River Basin, Washington, USA. Climatic Change. Article author: Devlin Mee, William O. Douglas Honors College, Central Washington University
Article editor: Dr. Tamara Caulkins, William O. Douglas Honors College, Central Washington University
2 Comments
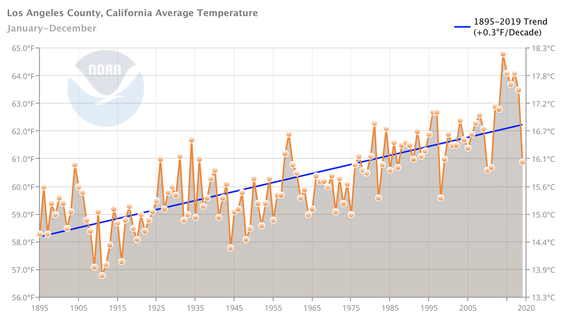 Average annual temperatures in Los Angeles County from 1895 to 2020. Source: NOAA Climate at a Glance. Climate changes and the local environment:Within the past century, the average temperature in Los Angeles County has increased by 3˚C. The number of days with a maximum temperature above 90˚ F has increased steadily over the past 20 years and is projected to continue rising. In addition to warmer average temperatures, Los Angeles County has experienced a decrease in precipitation during the fall and winter seasons. Increasing temperatures and decreasing levels of precipitation have increased the County’s risk for more severe droughts, as well as wildfires. 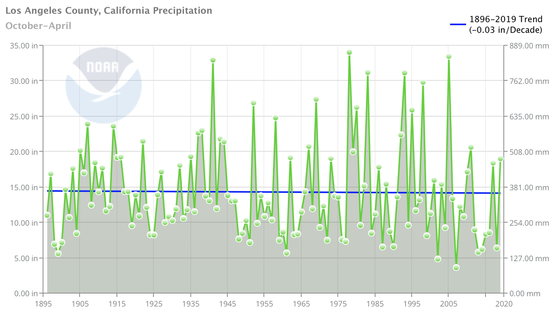 Average precipitation during the months of October to April in Los Angeles County from 1895 to 2020. Source: NOAA Climate at a Glance. Los Angeles County receives the majority of its annual rainfall during the late fall through early spring, then experiences a dry season during the summer months. The amount of winter season precipitation Los Angeles experiences has decreased over the past century, and this decline is predicted to continue. This reduction in rainfall means that there is less moisture in the soil at the beginning of the summer, which is the County’s dry season. The water evaporates from the soil and plants during the summer, and less winter precipitation ultimately leaves the vegetation drier earlier in the year. 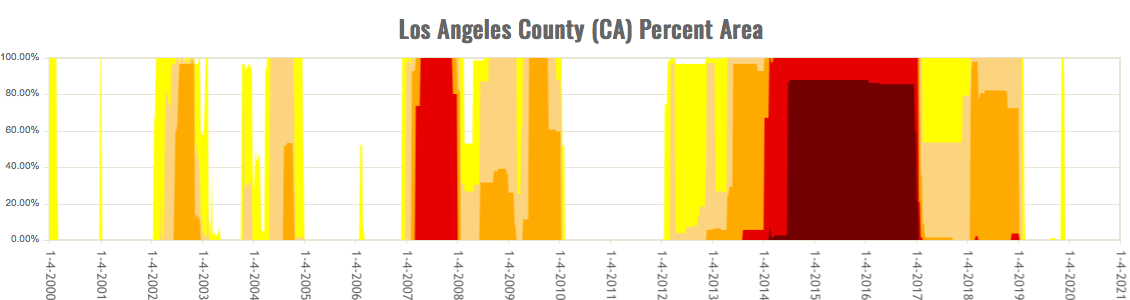 Drought severity in Los Angeles County from 2000 to 2020. Darker colors represent more severe droughts. Source: United States Drought Monitor. In addition to lower levels of rainfall, rising temperatures are reinforcing dryer and hotter summers in Los Angeles County. Higher annual temperatures lead to earlier snowpack melting, meaning that the winter season is shorter, there is less moisture in the soil during the dry season, and that the dry season is even longer. Warming temperatures also speed up evaporation, thus drying out the soil and parching the trees and vegetation. Drier and hotter summers have increased Los Angeles County’s drought risk, and by 2050 California’s risk of summertime drought is expected to almost triple. California’s dry and hot summers have always made the state more vulnerable to wildfires; however, rising temperatures and lower levels of precipitation have made the fire seasons longer and more severe. Los Angeles County’s fire season has already lengthened by approximately 75 days, and will likely increase in the future as well. With a longer and wetter winter season, Los Angeles County’s vegetation would soak up moisture which could help prevent summertime wildfires. This moisture dried out slowly through the summer season until it could be replenished the following fall. However, because the summer season has grown longer and hotter, and fall and winter rainfalls have decreased, flammable tinder has accumulated to high levels. Moreover, fire suppression over the last several decades has only added to the dangerous levels of tinder that has been available, and will continue to be available, to burn. How we know:These reconstructions are based on two easy to use tools that are freely accessible online: the National Oceanic and Atmospheric Administration (NOAA) Climate at a Glance tool and National Drought Mitigation Center's United States Drought Monitor. NOAA's Climate at a Glance tool uses data collected at weather stations and stored in NOAA's U.S. Climate Divisions database. This data is used to generate graphs about temperature, precipitation, and droughts, with the ability to look at global, national, and local averages. The Drought Monitor produces maps of drought conditions across the United States and publishes them weekly. The tool combines climate, soil, and water data with reports from 350 experts across the country. This generates an assessment of current drought conditions nationally, with the ability to look at data for individual states or counties. Human consequences:Warmer average temperatures, dryer seasons, and changing seasonal time frames have increased the number of wildfires in Los Angeles County, as well as in the intensity of the flames. Of the 20 largest fires to ever occur in California, two of them occurred in the last 10 years in Los Angeles County: the Thomas Fire in 2017 and the Station Fire in 2009. Over the past 50 years, summertime forest fires in the state have increased in size by approximately 800%, and 11.2 million residents in California currently live in areas with elevated risk for wildfires. Residents of Los Angeles County have already experienced the severe impacts of these wildfires. Wildfires release toxic smoke into the air, leaving dangerous air quality conditions, ash, and debris in their wake. Additionally, as wildfires rapidly spread, citizens can be forced to evacuate and in the worst situations, can lose their properties and homes to the fires. In 2018, the worst year of California wildfires on record, fires destroyed over 24,000 homes and buildings in the state. This increased risk of fire damage to residents’ homes has increased economic inequality in Los Angeles County, as wealth significantly enhances one’s possible response to wildfires. As early as 2005, wealthy individuals have been able to sign up for Private Fire Protection Services, typically at a high cost. While most individuals affected by fires were forced to flee their homes, wealthy individuals were able to wait out wildfires in luxury hotels while private firefighters worked to defend their properties from impending flames. This disparity was evident during the most recent Thomas Fire in 2017, when farm-owners left their properties to seek safety and returned to find their crops — and ultimately their livelihoods — destroyed. At the same time, many wealthy celebrities returned to their mansions on the beach, next-door to the farmers, with their properties untouched by the flames. Some climate activists have begun to refer to this emerging phenomenon as an impending “disaster apartheid.” As climate change continues to exacerbate wildfires and natural disasters become more frequent, there is a worry that a divide will form between “common” middle- and lower-class individuals and the wealthy elite. Los Angeles County will need to work especially hard in the near future to ensure that wealth does not drive a further wedge between its residents in the face of climate change. Further reading:California's New Normal: How the Climate Crisis is Fueling Wildfires and Changing Life in the Golden State. CNN California Wildfire Preparedness. States At Risk Why Does California Have So Many Wildfires? The New York Times Article Author: Benny Weisman, Georgetown University
Article Editor: Maddie Bowen, Georgetown University 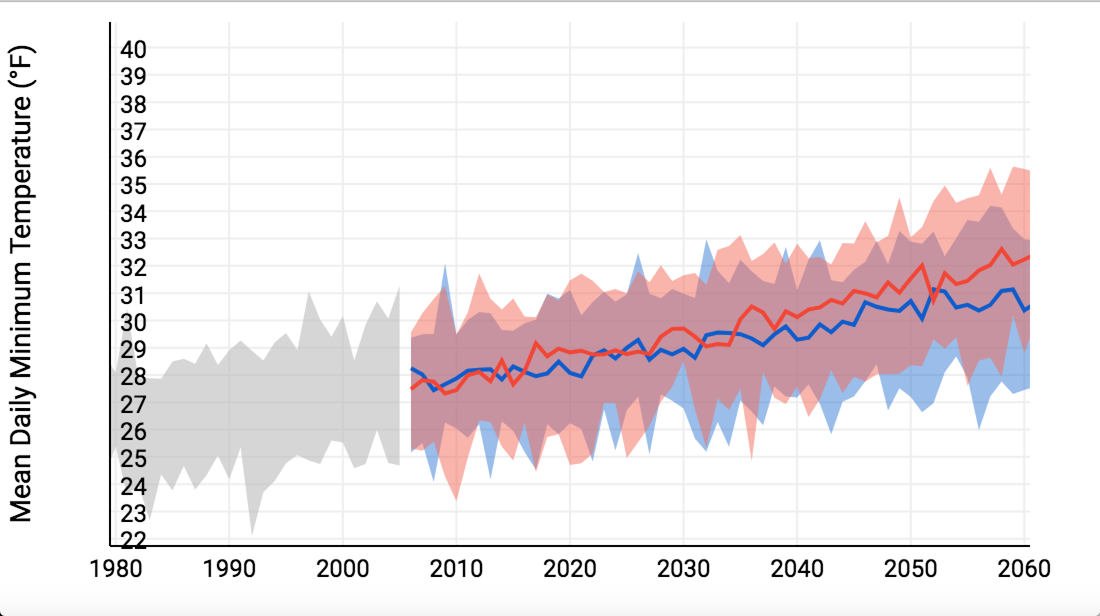 Average daily minimum temperatures in Larimer County, CO. Source: NOAA Climate at a Glance. Climate changes and the local environment:Average annual temperatures in heavily-forested Larimer County have steadily increased since the 1970s. Since the rate at which water evaporates rises as temperatures warm, drought has grown more common in the county. Drought places pine trees in the county under stress, leaving them vulnerable to infestation by mountain pine beetles. Cold winter temperatures can kill these beetles and their larvae, especially if temperatures fall quickly in autumn. Yet rising winter temperatures have permitted huge numbers of beetles to survive into each spring. Meanwhile, by suppressing forest fires, foresters in Larimer County have made forests unnaturally dense with mature trees. Since mountain pine beetles prefer big trees with thick bark, these older trees are especially vulnerable to infestation. 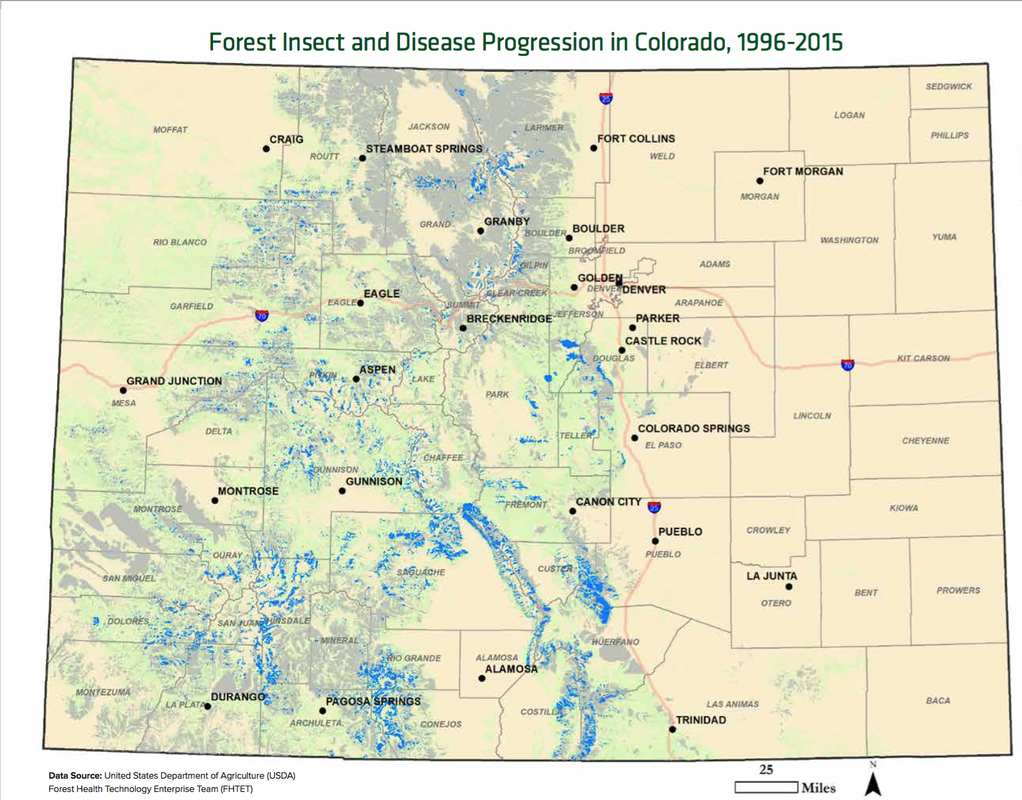 Map showing the amount of forests in Colorado that have been affected by diseases or insects from 1996-2015. The grey shading indicates forests that were affected from 1996-2014, and the blue color indicates forests that were newly affected in 2015. This map was produced from aerial data and provided by the United States Department of Agriculture. Source: Colorado State Forest Service. An attack begins with a single female beetle. The beetle burrows into the bark of a pine tree and releases a pheromone signal. The signal summons more beetles, which gather and attack the tree. Once the tree has been compromised, meaning that the flow of nutrients through the trunk has been impeded, the beetles deposit their larvae and continue onward, attacking nearby mature trees. While trees have numerous natural defenses to these beetles, the stress imposed on them by warming temperatures compromises their ability to use those defenses. To make matters worse, the mountain pine beetle has evolved to be able to ingest toxic resin that acts as one of the tree’s natural defenses. There is a cyclical character to mountain pine beetle infestations. As mature trees die and their population declines, so do numbers of mountain pine beetles. Yet rising temperatures and increasing drought have nevertheless expanded the beetle's range and overall population size. Since dead trees release carbon dioxide as they decay, mountain pine beetles are turning the forests of Larimer County and the western United States into a source of greenhouse gases that contribute to global warming. They are therefore worsening the climatic trends that have contributed to their booming numbers. How we know:This information is based on reliable, easy to use tools provided by the National Oceanic and Atmospheric Administration (NOAA) State Annual and Seasonal Time Series and the NOAA Climate at a Glance app. Both tools use data collected at weather stations and stored in NOAA's U.S. Climate Divisions database. This article also draws on data from a 2015 aerial survey administered by the Colorado State Forest Service. 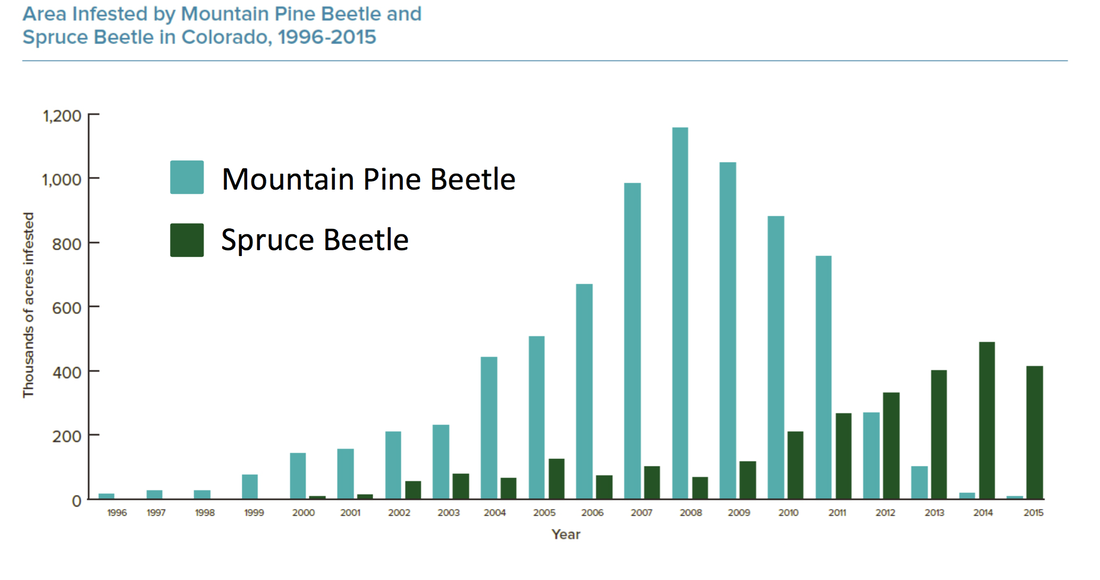 Graph showing the acreage of Colorado forest that was infested by the Mountain Pine Beetle and the Spruce Beetle from 1996-2015. Source: Colorado State Forest Service. Human consequences:Colorado forests purify the air and water; generate reliable sources of wood products; and provide opportunities for lucrative outdoor recreation activities. Some 90% of Colorado's inhabitants engage in outdoor recreation per year, and everyone benefits from the crucial economic and environmental resources generated by the state's forests. As of 2017, the state has a $17.3 billion tourism industry that relies on the aesthetic beauty of forested landscapes to attract visitors. Colorado is therefore a state that depends on the health of its forests. Thus, a threat to Colorado’s environment is a threat to its social and economic wellbeing. Perhaps the most profound consequence of the mountain pine beetle epidemic for the people of Larimer Country involves the relationship between warming, beetle infestations, and wildfires. Dry, dying trees are much more vulnerable to wildfires, and length of the annual wildfire season in Colorado has therefore increased by more than two months since 1970. In their immediate vicinity, wildfires threaten human property, livelihoods, and safety. Even at range, wildfire smoke can threaten human health, as inhalation can compromise respiratory function. Wildfires and declining overall forest health also reduce the quality of available water in Larimer County, and across Colorado. Forests naturally filter precipitation, maintaining clear waterways, but wildfires threaten water quality by introducing toxins into streams and watersheds. Since decaying trees release nitrates, mountain pine beetle infestations also increase the concentration of dangerous nitrates in the water supply. Larimer County officials are therefore carefully monitoring water quality in their county. Their efforts - and those of officials across Colorado - have broad significance. Nineteen states obtain their water supply from river systems originating in Colorado. Warming will impact not only the supply, but also the safety, of the water they acquire. Further reading:Pine Beetle Epidemic. National Geographic 2015 Report on the Health of Colorado’s Forests. Colorado State Forest Service 2012 Report on the Health of Colorado’s Forests. Colorado State Forest Service Climate Change and Ecosystem Disruption. Am J Public Health Mountain Pine Beetle & Cold Temperatures. Government of Alberta Clean Air, Water and Soil. Larimer County Website Article author: Esther Doerr, Georgetown University
Article editors: Dr. Dagomar Degroot, Georgetown University; Sarah Harper, Georgetown University 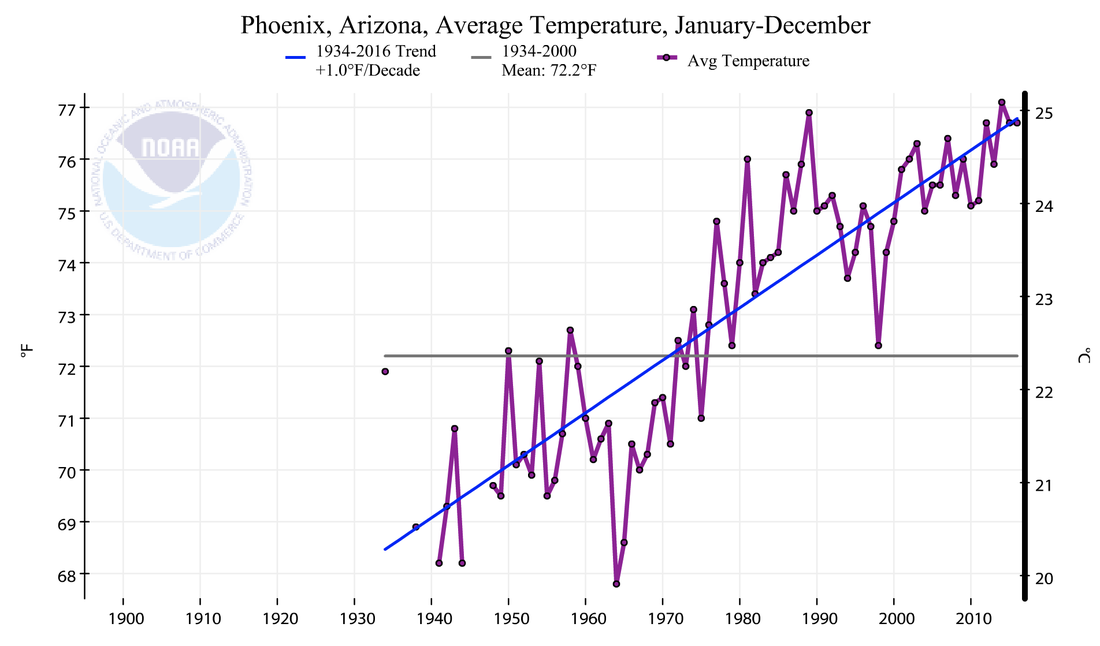 Average annual temperatures in Phoenix, the county seat of Maricopa County, 1935-2017. Source: NOAA Climate at a Glance. Climate changes and the local environment:Since 1970, average annual temperatures in Arizona have soared. In densely-populated Maricopa County, which includes Phoenix, average annual temperatures have risen by over 7° F (nearly 4° C), which is roughly four times the global average. In no major U.S. city have temperatures climbed more quickly. This remarkable rise has sharply increased the frequency of particularly extreme weather. In the summer of 2017, for example, a heat wave sent temperatures soaring to over 120° F (nearly 50° C). Summer days with relatively cool temperatures, by contrast, have grown scarce. From June to September 2017, only 14 days had high temperatures lower than 100° F. Higher temperatures have increased rates of evaporation across Arizona, and therefore dried much of the state. Average annual precipitation in Maricopa County has actually increased slightly over the past century, yet precipitation in mid to late summer has declined substantially. Summer droughts have therefore become common in Maricopa County. Warming, drying trends have created ideal conditions for wildfires across Arizona, including in Maricopa County. Wildfires in Arizona have therefore grown more frequent, and they last longer. In spring 2017, a wildfire in Maricopa County’s Tonto National Forest consumed some 500 acres of woodland. 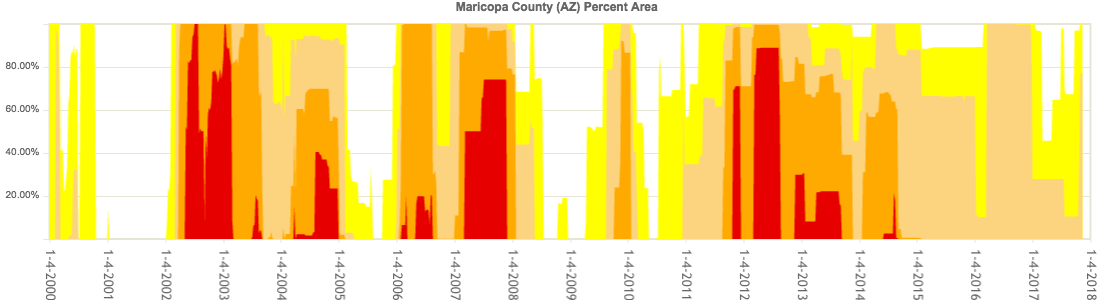 Drought severity in Maricopa from 2000 until 2017. Darker colors represent worse droughts; higher values mean more of the county was in drought. Source: United States Drought Monitor. How we know:These reconstructions are largely based on reliable, easy to use tools that are freely accessible online: the National Oceanic and Atmospheric Administration (NOAA) State Annual and Seasonal Time Series, the NOAA Climate at a Glance app, the National Drought Mitigation Center's United States Drought Monitor. NOAA's State Annual and Seasonal Time Series and Climate at a Glance tools use data collected at weather stations and stored in NOAA's U.S. Climate Divisions database. The Drought Monitor compiles weekly maps of drought conditions across the United States, and combines climate, soil, and water data with reports from 350 experts across the country. 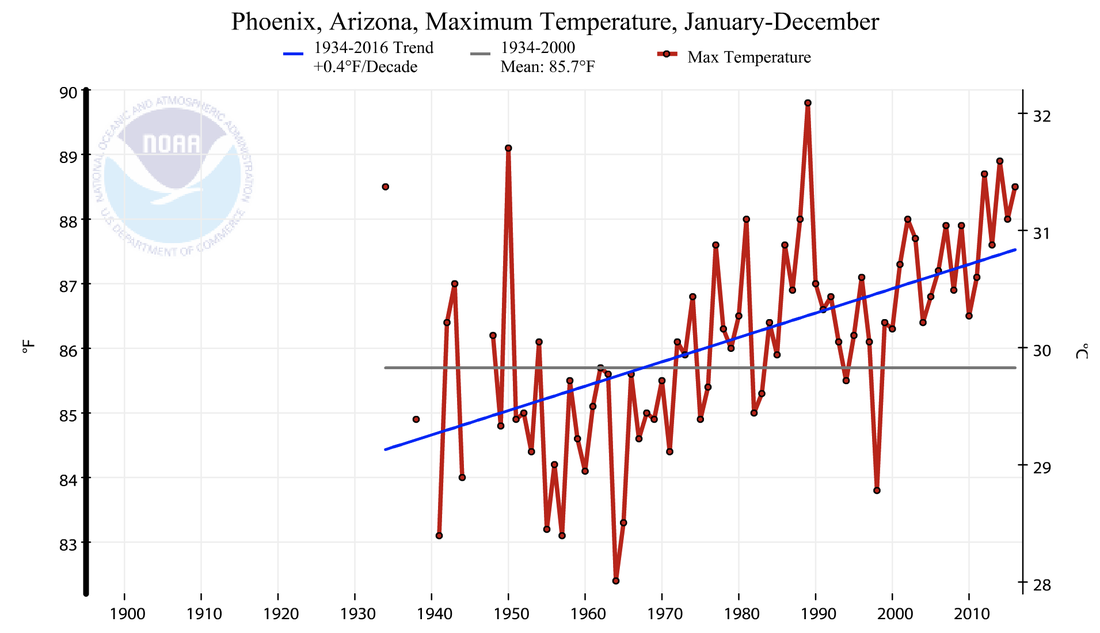 Average daily maximum air temperature in Phoenix, 1934-2017. Source: NOAA Climate at a Glance. Human consequences:Rising summer temperatures in Arizona have increased the number of heat-related deaths in Maricopa County. Especially hot, dry weather can provoke dehydration and heat stroke, and can interfere with cardiovascular, respiratory, and nervous systems. The very old, the very young, and the sick are especially vulnerable, particularly in poor neighborhoods where some households might not have dependable access to air conditioning. Employees who spend most of their time outside - such as construction workers - are also at risk. Heat-related threats to human health can be especially great in cities like Phoenix, where paved surfaces create urban heat sinks that amplify hot temperatures. In 2016, Maricopa County endured 130 heat-related deaths, the most in the last 15 years. On average, Arizona hospitals now treat almost 2,000 patients per year for heat-related illnesses. Many injuries and deaths not only reflect warming trends, but also social and infrastructural problems that make it hard for people to escape the heat. Wildfires in Arizona, including in Maricopa County, have also proven costly for state and federal governments. Containing the Arizona wildfires has cost many millions of dollars, and the total costs of wildfires can exceed suppression costs by more than 30 times. In Maricopa County, smoke billowing from fires in Tonto National Forest, for example, shut down Bush Highway. Foresters have conducted controlled burns to limit the future risk of major wildfires in the forest, but prolonged drought has foiled some of these efforts. In Phoenix, the municipal government has taken steps to lower the city's contribution to climate change. It has expanded public transit, constructed new bike lanes, purchased electric vehicles, installed low-energy bulbs in street lighting, and set ambitious goals for cutting greenhouse gas emissions. Still, adapting to climate change has proven to be an even more daunting task, especially for the city's less affluent residents. Further reading:A Building Boom and Climate Change Create an Even Hotter, Drier Phoenix. LA Times Phoenix Will Be Almost Unlivable by 2050 Thanks to Climate Change. Vice Article author: Luke Powers, Georgetown University
Article editor: Dr. Dagomar Degroot, Georgetown University 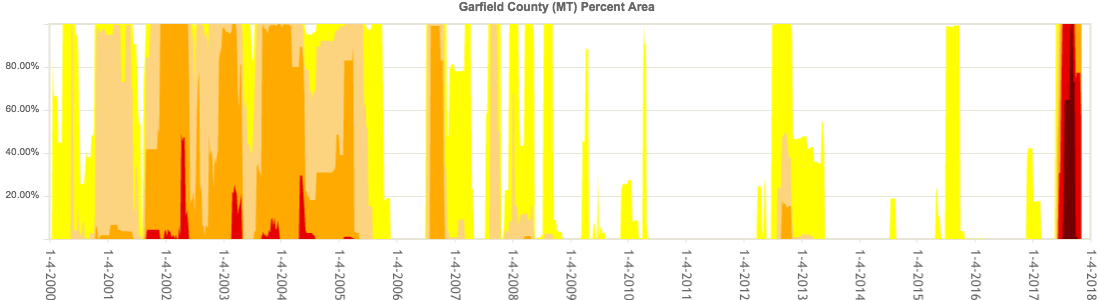 Drought severity in Garfield County from 2000 until 2018, showing the drought of 2017. Darker colors represent worse droughts; higher values mean more of the county was in drought. Source: United States Drought Monitor. Climate changes and the local environment:Over the past century, average annual temperatures have soared across Montana, rising by almost 2° C (3° F) relative to twentieth-century averages. Warming has shortened winters, and earlier thawing has prevented snow from accumulating. Hotter spring, summer, and fall temperatures have also increased the rate of evaporation across Montana. Average annual precipitation in Montana has increased modestly. However, rainfall has only increased in the early spring and late fall, and precipitation in the summer has actually become more scarce. The summer dry season is therefore drier and longer than it once was. Extreme droughts are now much more likely to occur than they once were. Together, these changes have created ideal conditions for wildfires in heavily forested but sparsely populated Garfield County, Montana. In the summer of 2017, no fewer than 21 wildfires broke out in Montana during a particularly severe, long-lasting drought. Together, the wildfires consumed nearly 1.3 million acres of forest, and two fires alone each burned across over 100,000 acres. National data suggests that climate change, not shifting forest management practices, were responsible for the 2017 wildfires in Garfield county. Beginning in the 1980s, large wildfires across the United States suddenly grew more common, and lasted longer, especially in regions lightly touched by forest management practices. Almost everywhere, rising spring and summer temperatures, and an earlier spring snowmelt, were largely to blame. By burning through old trees and brush, wildfires can bring new life to a forest, making way for diverse plant species and creating new habitats for animals. Yet the dramatic increase in the frequency, scale, and length of wildfires in Montana has interfered with the ability of forests to recover. 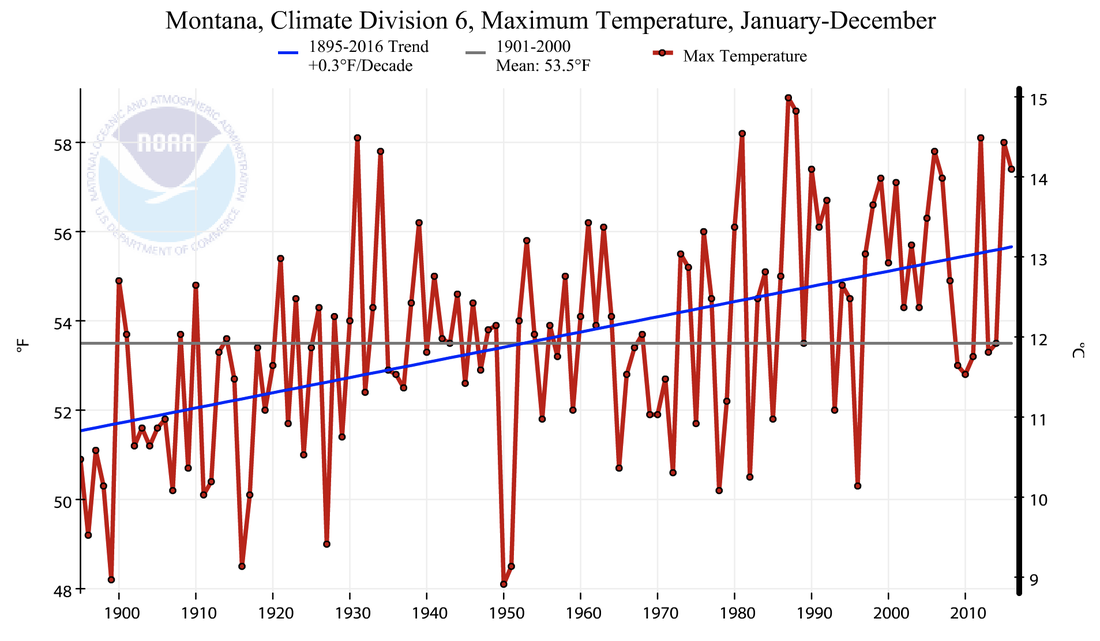 Average daily maximum air temperature in northeastern Montana, 1895-2017. Source: NOAA Climate at a Glance. How we know:These reconstructions are largely based on reliable, easy to use tools that are freely accessible online: the National Oceanic and Atmospheric Administration (NOAA) State Annual and Seasonal Time Series, the NOAA Climate at a Glance app, the National Drought Mitigation Center's United States Drought Monitor. NOAA's State Annual and Seasonal Time Series and Climate at a Glance tools use data collected at weather stations and stored in NOAA's U.S. Climate Divisions database. The Drought Monitor compiles weekly maps of drought conditions across the United States, and combines climate, soil, and water data with reports from 350 experts across the country. These reconstructions also draw on visualizations provided by the National Interagency Fire Center, which has created a tool that predicts the potential of new wildfires based on previous weather conditions. They also rely on an important 2006 study in the journal Science, which finds clear links between warming and wildfires. 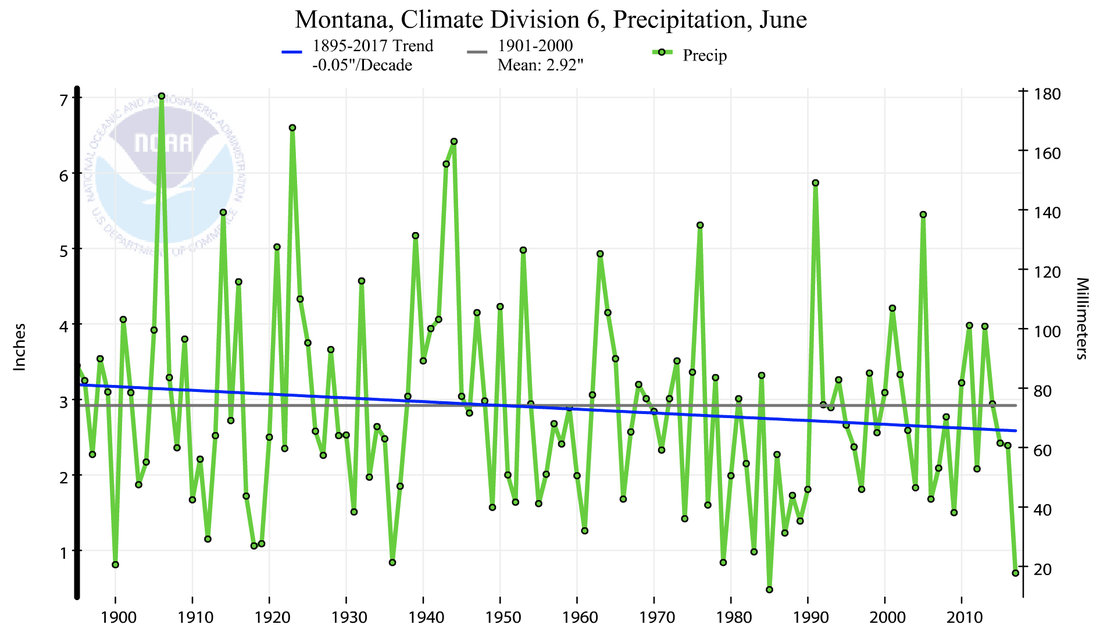 Average June precipitation in northeastern Montana, 1895-2017. Source: NOAA Climate at a Glance. Human consequences:In recent decades, the environment of Garfield County has grown more dangerous for its human residents. In 2017, the Lodgepole wildfire spread into Garfield County and eventually consumed an area the size of New York City. After billions of dollars were spent to control the fire, and two firefighters lost their lives, the county nevertheless lost over 20 buildings. Meanwhile, drought and wildfires have together undermined cattle ranching, a staple of Montana's economy and culture. Fires not only destroyed grazing land and killed cattle, but also incinerated nearly 2,300 km (1,300 miles) of fencing, and required costly hay imports. Some ranchers have had to sell cattle in huge quantities because there is no more grazing land to support them, and many ranchers will lose "genetics" that have taken years to hone. Young ranchers have seen their businesses ruined before they ever got off the ground. 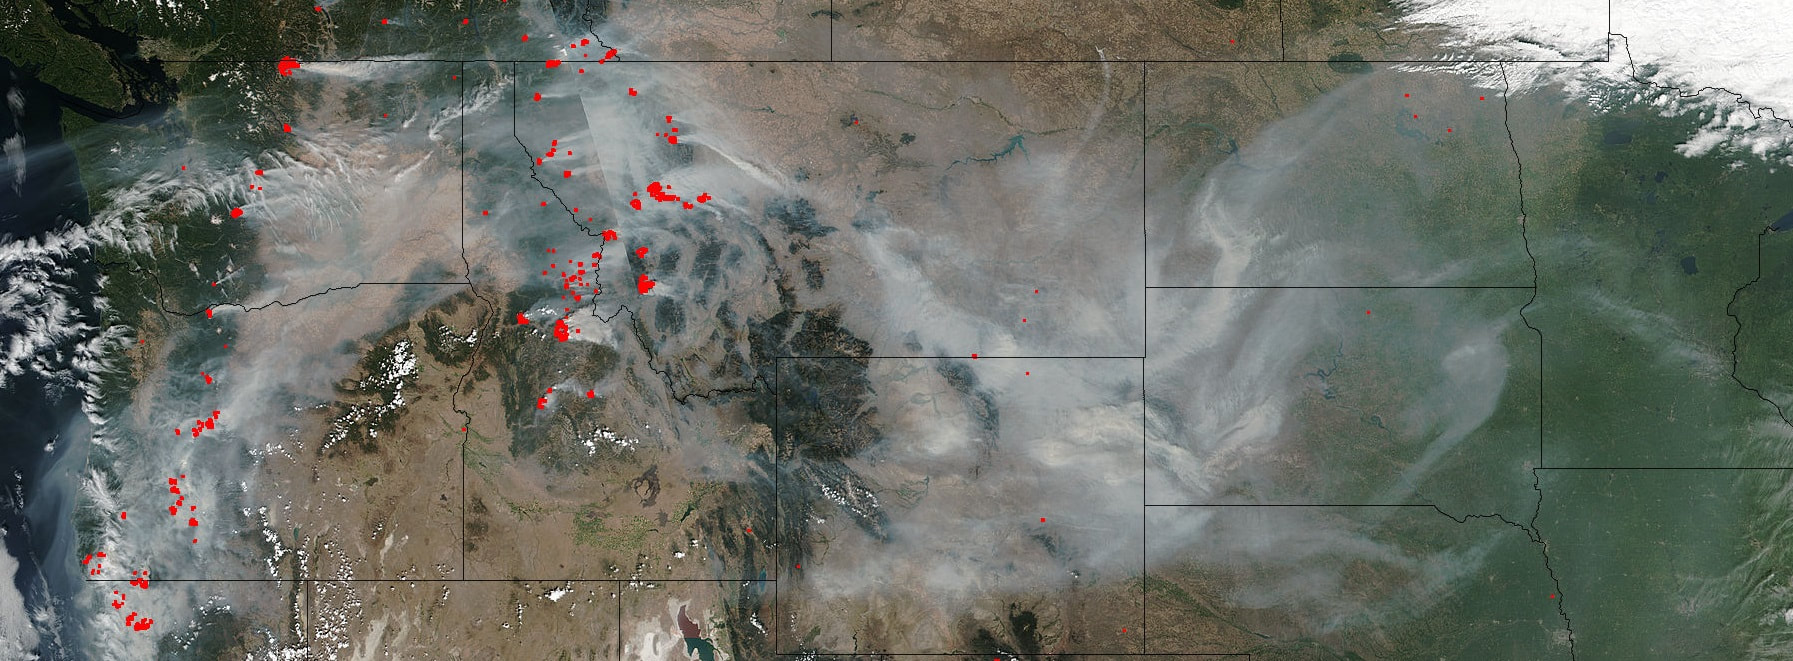 A satellite image of wildfires across the western United States in summer, 2017. Source: NASA The destructiveness of the 2017 wildfires have provoked renewed debate about logging in the forests of Montana. Advocates insist that logging reduces the risk of forest fires and spurs Montana's economy. Skeptics point out that although millions of acres of forest have been cleared of dangerous fire "fuels" - including in Garfield County - wildfires nevertheless burned uncontrollably. Droughts worsened by climate change have overwhelmed local attempts to confront wild fires. Further reading:Long-term Losses of Montana's Fire Season Amount to Much More than Scorched Grass. Billings Gazette Montana Wildfires Reignite Logging Debate. NPR Wildfire Myths: Logging the Forest Won’t Save It. Counter Punch Garfield County Community Wildfire Protection Plan. Walsh Environmental Scientists and Engineers, LLC Article author: Sabine Neschke, Georgetown University
Article editor: Dr. Dagomar Degroot, Georgetown University 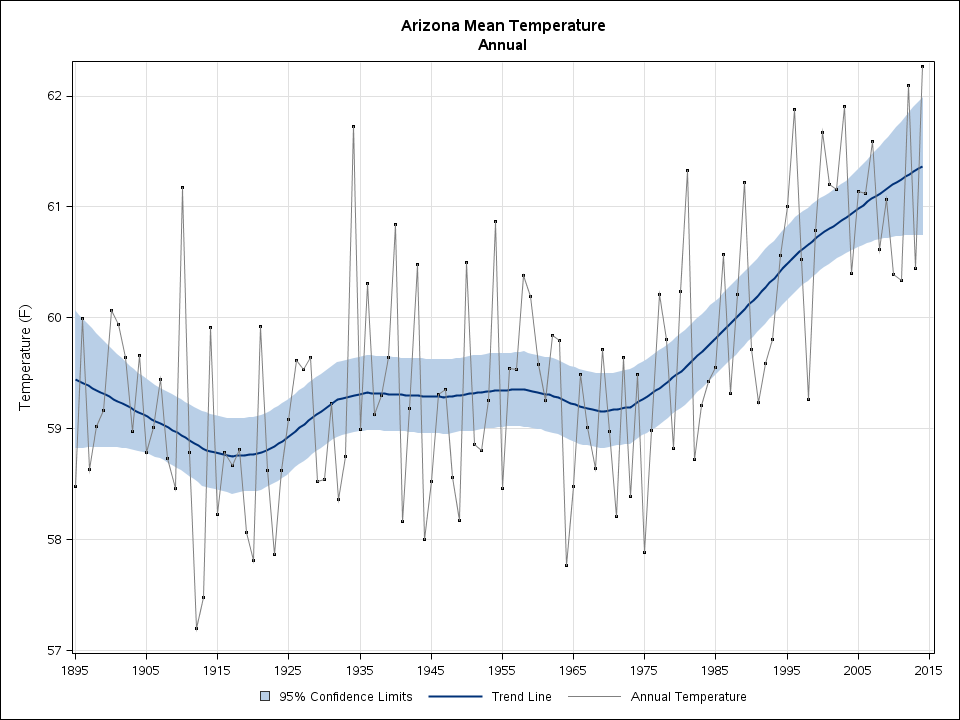 Mean annual temperatures in Arizona since 1895. Source: NOAA State Annual and Seasonal Time Series. Climate changes and the local environment:Mohave County is located in Northwestern Arizona, and includes part of the Grand Canyon National Park, as well as several federally recognized Native American Reservations. Its annual average temperatures have risen by an average of 0.2°F per decade between 1895 and 2016. However, this average hides the fact that average temperatures in the county and the state were mostly stable until roughly 1975. After that year, the trend in average temperatures began rising very quickly, and this caused a worrying increase in the frequency and intensity of wildfires and droughts. These weather and climate-related events have had devastating effects in the local environment. As much as 15 per cent of Arizona is covered by national forests, and the hotter and drier conditions have made it easier for wildfires to occur. According to U.S. Forest Service records, large wildfires (of more than 1,000 acres) in the state have increased from approximately 5 per year before 1980, to a current average of near 20. Drought has affected the Colorado river, a source of water for over 30 million people, including a large share of Mohave County and the State of Arizona. For example, the Upper Colorado Basin has seen more common and severe droughts in the last 50 to 90 years. In the period between 2000 and 2014, the river’s flow declined by 19 per cent compared to the average between 1906 and 1999. Researchers have estimated that warmer temperatures account for up to one-sixth of these losses, which are approximately equal to enough water to support 1 million households for a year. 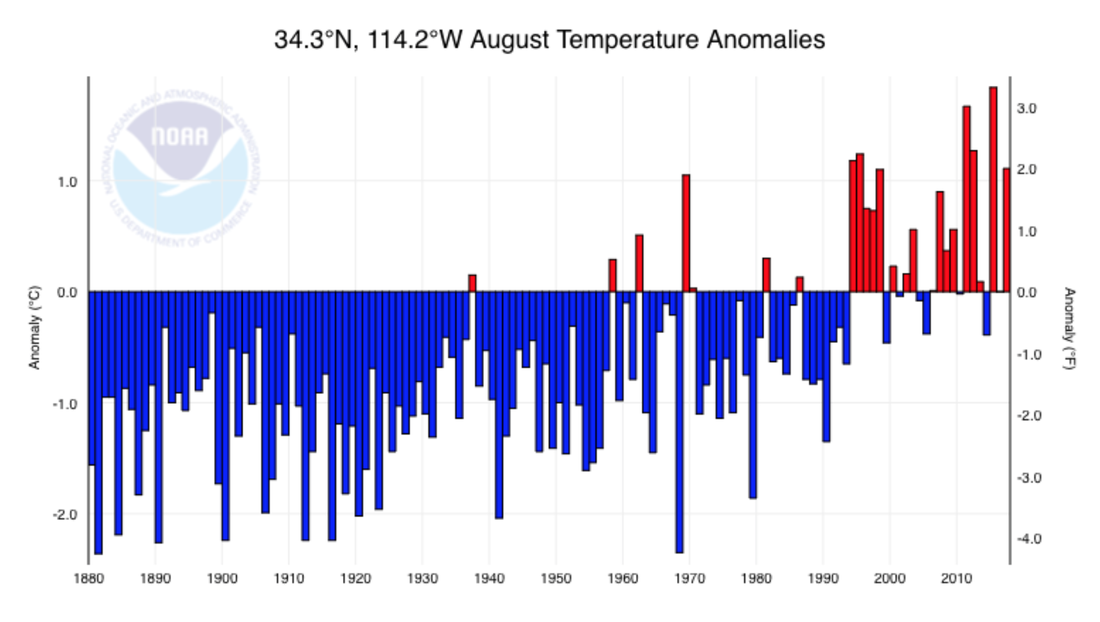 Since the 1990s, Lake Havasu City, a city in Mohave County that borders with Southern California, has seen average temperatures in August that are much higher than the long-term average for that month. Source: NOAA. How we know:These climate and weather reconstructions are based on several tools made available online by several United States agencies, such as the National Oceanic and Atmospheric Administration (NOAA)’s State Annual and Seasonal Time Series. This site is useful to see the evolution of temperatures at the state level since 1895, and its information is obtained from the U.S. Climate Divisional Dataset, used often for agricultural matters. NOAA’s Climate at a Glance tool is intended for studying the changes and variability of climate, and has adjusted the data to take into account artificial effects that affect climate, such as urbanization. Another important resource is the United States Drought Monitor, which develops weekly maps of drought conditions across the country, and uses climate, soil, and water data, together with reports from 350 experts across the country. The U.S. Climate Resilience Toolkit helps people become informed about their risks and opportunities related to the changing climate, and to help them become more resilient. One of its tools is the Climate Explorer, which allows users to explore the potential damaging effects of climate on the population and their valued possessions, such as land and crops. To do this, it shows projections of temperatures, precipitation, and others for two possible futures: one in which humans make a moderate attempt to reduce their carbon emissions, and another in which humans continue to act as usual. 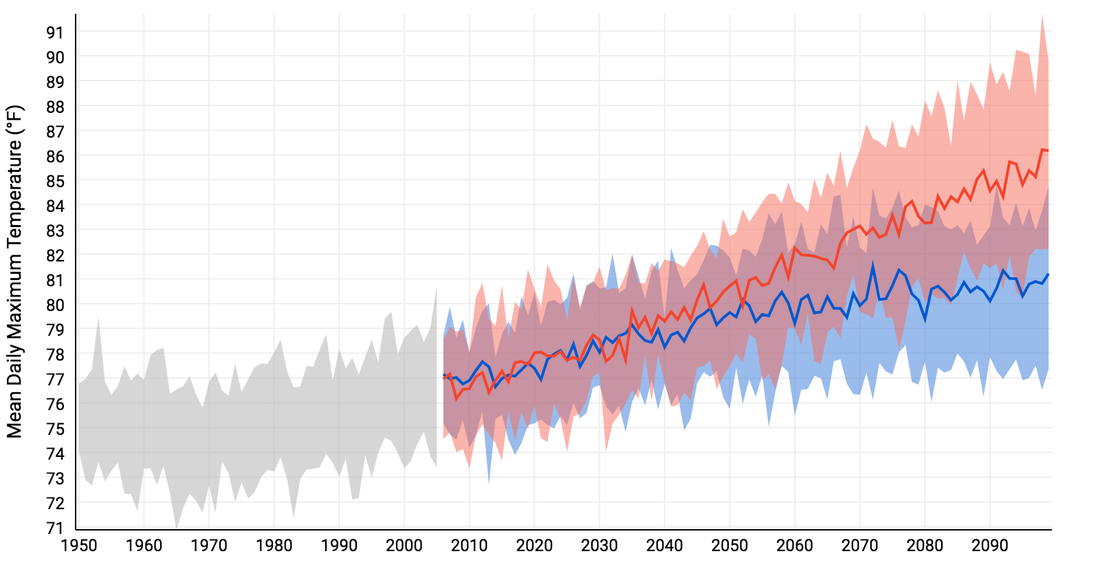 Average daily maximum temperatures in Mohave County, Arizona. Grey shows the historical trend since 1950. Red shows the projection for a future with higher emissions, and blue with lower emissions. Source: NOAA U.S. Climate Resilience Toolkit (Climate Explorer). Some of the biggest effects of climate change in Arizona have been linked to health concerns, disruptions in the water supply for farms and cities, and the destruction of the environment with wildfires. In the summer of 2017, the state made nationwide news when numerous flights were cancelled in Phoenix due the excessive heat. These extreme temperatures caused near 1,300 deaths between 2005 and 2015, and the number of heat-related illnesses has been increasing, according to a medical director at the Banner University Medical Center in Phoenix. The Environmental Protection Agency (EPA) has reported that more than 2 per cent of the land in Arizona has burned per decade since 1984, and the smoke produced often damages the quality of the air and water, and creates health problems for the population. In Mohave County, the most significant human consequences of climate change can be found in the water supply disruption to households, and in the Native American communities. Decreasing water reserves in important bodies of water like Lake Mead, and the increasing water needs due to growing cities and new farms that move from California’s even more extreme water shortage, have led to severe concerns and restrictions on water use. Native American tribes have seen their traditional practices challenged, as they are typically very dependent on agriculture and the raising of livestock, which in turn depend on weather and the availability of water. For the Mohave tribe, a drier Colorado River means a disruption to their traditions, as they believe that the river was created by their ancient deity Mastamho as part of their sacred landscape. Despite this worrisome picture, in a Climate Central report, Arizona’s government received a failing grade for its average level of wildfire preparedness, and a near-failing grade for its drought preparedness, as its plans do not account for the devastating effects of climate change. Further reading:The Future is Drying Up. NY Times Magazine Where the River Runs Dry. The New Yorker The $2.4 Billion Plan to Water California by Draining the Mojave. Wired Wildfires, Once Confined to a Season, Burn Earlier and Longer. NY Times Article author: Alejandro Carrera Rodriguez, Georgetown University
Article editor: Dr. Dagomar Degroot, Georgetown University 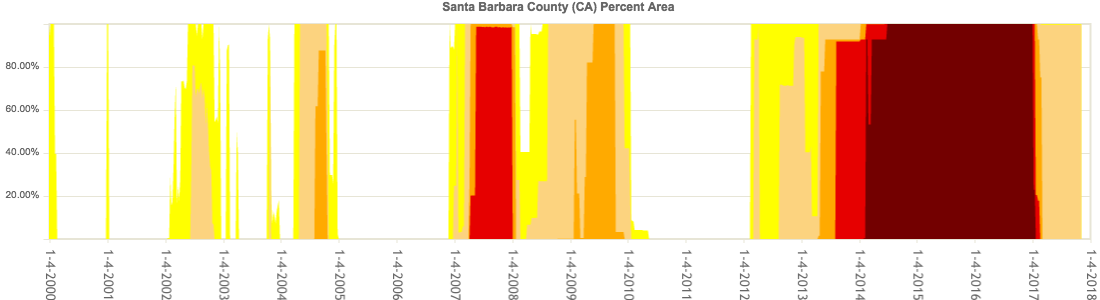 Drought severity in Santa Barbara County from 2000 until 2017, showing the landmark drought of 2014-2017. Darker colors represent worse droughts; higher values mean more of the county was in drought. Source: United States Drought Monitor. Climate changes and the local environment:Average annual temperatures across California have been rising since the nineteenth century, a trend that has sharply accelerated since around 1970. Average temperatures across all seasons in Tulare County in south central California have mirrored that statewide pattern. As the county warmed, it suffered a series of severe droughts, which are usually defined as long-lasting moisture deficits that have environmental and social consequences. Droughts in the county involve three sources of water: surface water at low elevations, snow at high elevations, and groundwater buried below the surface. Precipitation in much of California has long varied by as much as 50% from year to year. Hotter temperatures, however, are increasing the rate of evaporation across California, including in Santa Barbara County. That has affected both mountain snow and lowland liquid water, and has made local droughts even longer and drier than they once were. One of the most severe droughts in the county's history recently began in February 2012 and lasted into 2017. The driest stretch of the drought started in February 2014 and endured until January 2017. It was part of a broader Californian drought that started in coastal areas several years earlier, and was up to 27% more likely to occur in our warmer climate. Longer, drier summers and an earlier snowmelt have caused drier forest conditions in southwest California, which has increased the amount of available kindling for wildfires to consume. These conditions have increased the size and duration of wildfires in California, and dramatically lengthened the wildfire season in Santa Barbara county. How we know:These reconstructions rely on several easy to use tools that are available online: the National Oceanic and Atmospheric Administration (NOAA) State Annual and Seasonal Time Series, the NOAA Weekly Palmer Drought Indices, the National Drought Mitigation Center's United States Drought Monitor, and the United States Geological Survey (USGS) interactive website. NOAA's State Annual and Seasonal Time Series relies largely on weather station measurements. NOAA's Palmer Drought Indices use a standard way of measuring drought that considers both water supply and demand in a soil moisture model. Negative values represent droughts, and positive values represent wet conditions. The United States Drought Monitor uses a number of drought indicators, including the Palmer Drought Indices, that consider both environmental and social manifestations of water shortages. The interactive tools made available by the USGS draw on open data provided by a range of United States government agencies, including the Army Corps of Engineers and the Bureau of Reclamation. 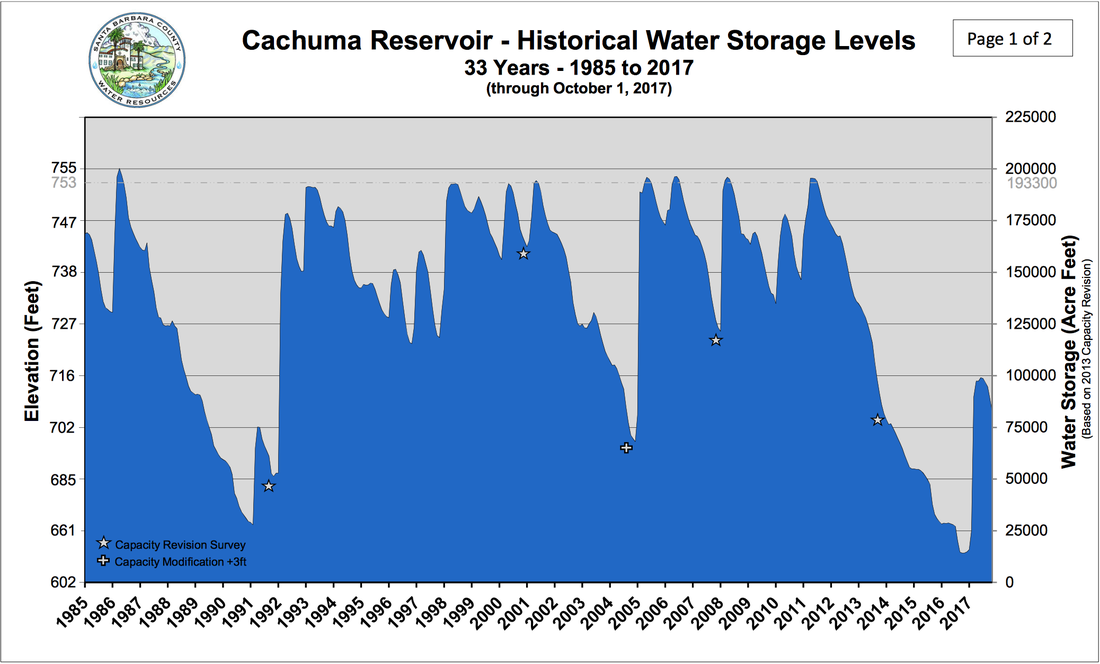 Water levels in Cachuma reservoir responded to the Californian drought. Human consequences:Droughts can sharply reduce the quantity of water in reservoirs and aquifers across California, which often supply water to local residents. Reservoirs, which collect precipitation, and aquifers, which are the groundwater storage spaces, both contribute to Santa Barbara’s water supply. This supply is crucial for both commercial and industrial use. If global warming continues, Santa Barbara’s premium wine industry could be significantly affected. This is because distinct grape species can only thrive in specific temperature ranges. If Santa Barbara fails to produce grapes that can tolerate higher temperatures, then the decline in suitable land could be up to 20%. Wine is currently the third-most produced commodity in Santa Barbara county, and wine sales comprise nearly a tenth of the county's economy. One of the main water sources that supplies residents in Santa Barbara county is the Lake Cachuma reservoir. The reservoir supplies 85 percent of the water supply for over 250,000 residents of Goleta district in Santa Barbara county. Its available water supply plummeted during the California drought. As of October 1st 2017, it is still only 43% full. The lack of water in the Cachuma reservoir, in conjunction with the drought, will force Santa Barbara county to search for alternative water sources. Just recently, the county decided to reopen its desalination plant to supply more water to their residents. The reactivation of this plant cost the county an estimated $71 million, not including the cost of maintaining the plant. It will supply 3 million gallons of water per day to residents to cover 30% of the city’s water usage. In a warmer and drier future, such desperate measures may well be necessary across California. Article author: Madeline Lee, Georgetown University
Article editor: Dr. Dagomar Degroot, Georgetown University 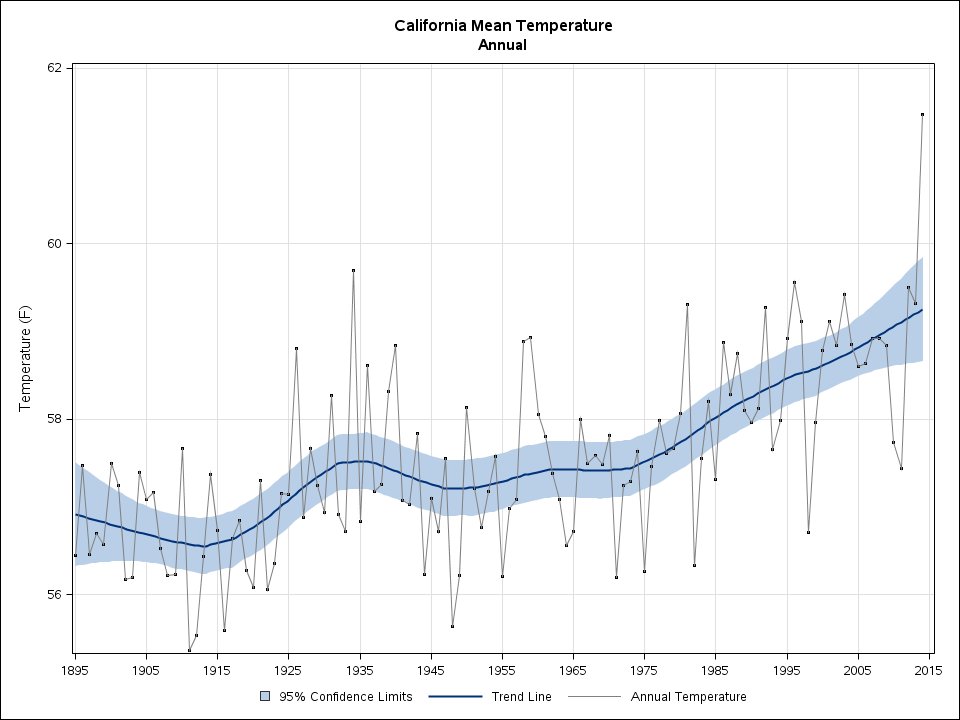 Mean annual temperatures in California since 1895. Source: NOAA State Annual and Seasonal Time Series. Climate changes and the local environment:Average annual temperatures across California have been rising since the nineteenth century, a trend that has sharply accelerated since around 1970. Average temperatures across all seasons in Tulare County in south central California have mirrored that statewide pattern. As the county warmed, it suffered a series of severe droughts, which are usually defined as long-lasting moisture deficits that have environmental and social consequences. Droughts in the county involve three sources of water: surface water at low elevations, snow at high elevations, and groundwater buried below the surface. Precipitation in much of California has long varied by as much as 50% from year to year. Hotter temperatures, however, are increasing the rate of evaporation across California, including in Tulare County. That has affected both mountain snow and lowland liquid water, and has made local droughts even longer and drier than they once were. One of the most severe droughts in the county's history recently began in 2014 and lasted until early 2017. It was part of a broader Californian drought that started in coastal areas several years earlier, and was up to 27% more likely to occur in our warmer climate. 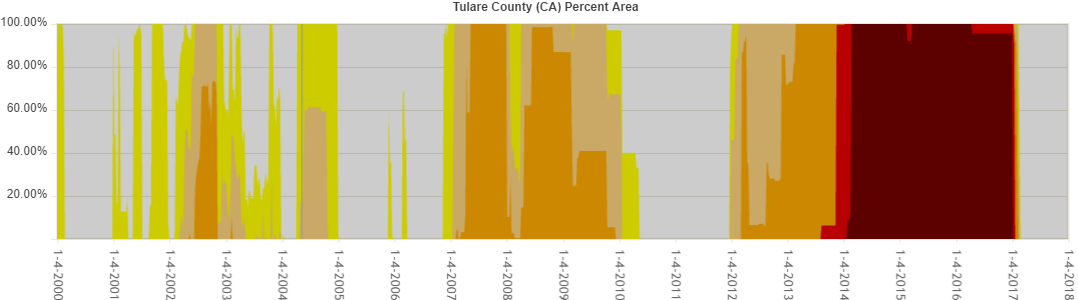 Drought severity in Tulare from 2000 until 2017, showing the landmark drought of 2014-2017. Darker colors represent worse droughts; higher values mean more of the county was in drought. Source: United States Drought Monitor. How we know:These reconstructions rely on several easy to use tools that are available online: the National Oceanic and Atmospheric Administration (NOAA) State Annual and Seasonal Time Series, the NOAA Weekly Palmer Drought Indices, and the National Drought Mitigation Center's United States Drought Monitor. NOAA's State Annual and Seasonal Time Series relies largely on weather station measurements. NOAA's Palmer Drought Indices use a standard way of measuring drought that considers both water supply and demand in a soil moisture model. Negative values represent droughts, and positive values represent wet conditions. The United States Drought Monitor uses a number of drought indicators, including the Palmer Drought Indices, that consider both environmental and social manifestations of water shortages. The above reconstructions also draw on an important study in Geophysical Research Letters, which estimates the possible contribution of global warming to the 2012-2014 drought in California. Human consequences:Severe droughts since the 1970s have badly hurt Californian farmers. In 2015 alone, farmers could not grow crops on nearly 500,000 acres of farmland, which accounted for a large share of the drought's annual economic cost to the state of nearly $3 billion. Tulare county was among the hardest-hit communities. The county has been one of the most productive agricultural counties in the United States. Its economy depends on the dairy industry, as well as crops such as oranges and grapes, which all require abundant water. Not only did these industries suffer particular hardships during the drought, but the drought also lasted longer in Tulare than it did in most other Californian counties. In 2014, the Tulare county Board of Supervisors declared a state of emergency and requested water transfers into the county from other parts of California. Yet hundreds of local wells remained dry into 2017. Many of the county's farms resorted to over-exploiting groundwater that may never fully recover, leaving them more vulnerable to future droughts that a changing climate will make longer and drier. While the recent drought has now ended, it may have long-lasting consequences for local agriculture. Further reading:
Article author: Dr. Dagomar Degroot, Georgetown University
|
 RSS Feed