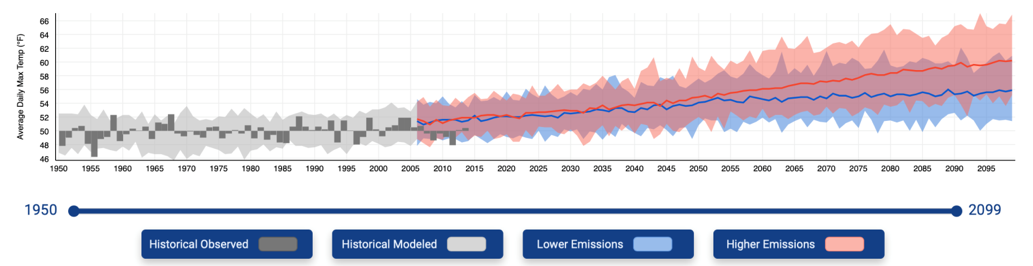
 Average maximum temperature in Chelan county from 1950 to 2006 with maximum temperature predictions up to 2099. Source: The Climate Explorer, National Environmental Modeling and Analysis Center (NEMAC), University of North Carolina, Asheville. Climate Changes and the Local Environment:Ever since the early 2000s, Chelan County in Washington has experienced an increase in average maximum temperature. This trend in increased heat is predicted to reach well into the future. At the same time, the average precipitation shows signs of decreasing, with the average precipitation from 2000-2020 being .26” less than in the twenty years previous. In addition, snow cover over the last five decades, been disappearing earlier and earlier in the year across areas of Russia, Alaska, Canada, and in parts of the northwestern United States. These factors have all contributed to an increase in wildfires across Washington, with a significant increase in large wildfires in the state starting in 2012. In 2012 alone, there were 12 large wildfires in Washington, four of them affecting Chelan County. At that point in time, Chelan county boasted the eighth highest occurrences of wildfires based on data spanning from 2003 to 2012. Then, in 2015, the fires grew to such a size that Washington state had to declare a state of emergency. That year, Chelan county was rocked by fire that burned 88,985 acres surrounding the city of Chelan. This fire was attributed to drought conditions cause by minimal snowpack and unusually high temperatures. Increased temperatures, decreased precipitation, and shorter snow cover seasons are elements of climate change that have huge negative impacts on the health of forests, leading to larger and more devastating wildfires. Though wildfires are a natural element of new growth in forested areas, the increase in devastation and frequency of large-scale fires is a danger to both humans and the natural environment. The ecosystem of Washington state forests could be severely impacted by the increase in large-scale wildfires. 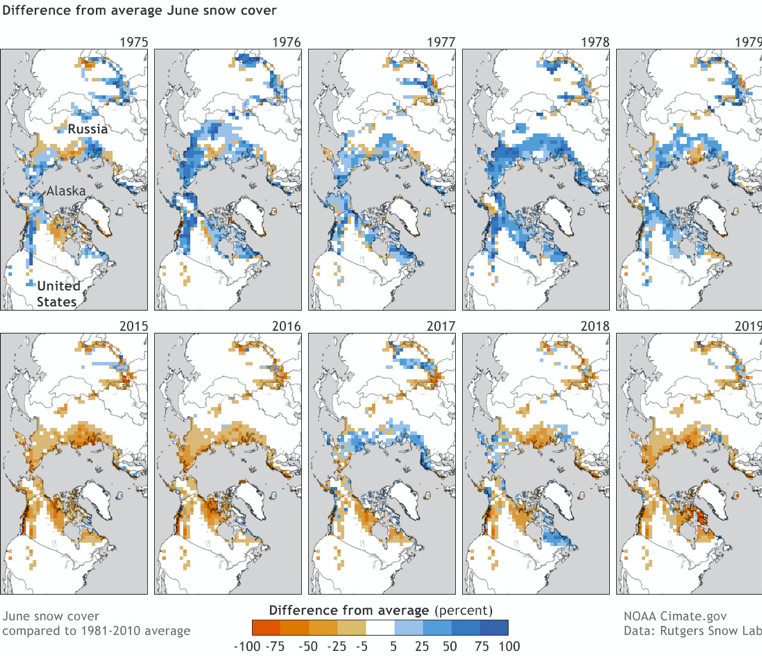 Snow cover decrease in the Northern Hemisphere from 1975 to 2019. Source: Global Climate Dashboard, National Oceanic and Atmospheric Administration (NOAA) Climate.gov, based on maps from Rutgers Snow Lab. How We Know: Much of the data used in this project comes from the following interactive tools: The Climate Explorer, the Global Climate Dashboard, and Climate at a Glance. Graphs from the Climate Explorer that show the increase in Chelan County’s average maximum temperature were created by combining observed historical data and current measurements to predict and model possible future trends in temperature. Climate at a Glance and The Climate Explorer are both run by the National Oceanic and Atmospheric Administration. County specific data is collected from NOAA’s US Climate Divisional Database, which contains climate data spanning from 1895 to 2020. Snow cover data has been collected from satellite images that have been mapping the snow extent of the Northern Hemisphere since the 1960s. This data, now collected daily as opposed to weekly as was the case in the sixties, is corroborated by various other measuring tools including observations, precipitation gauges, and weather stations with pressure-sensitive measuring tools. The fire data used in this report has been compiled from various sources including a Washington State Wildland Fire Profile from 2013, a report on the Chelan Complex fire of 2015, and various articles. 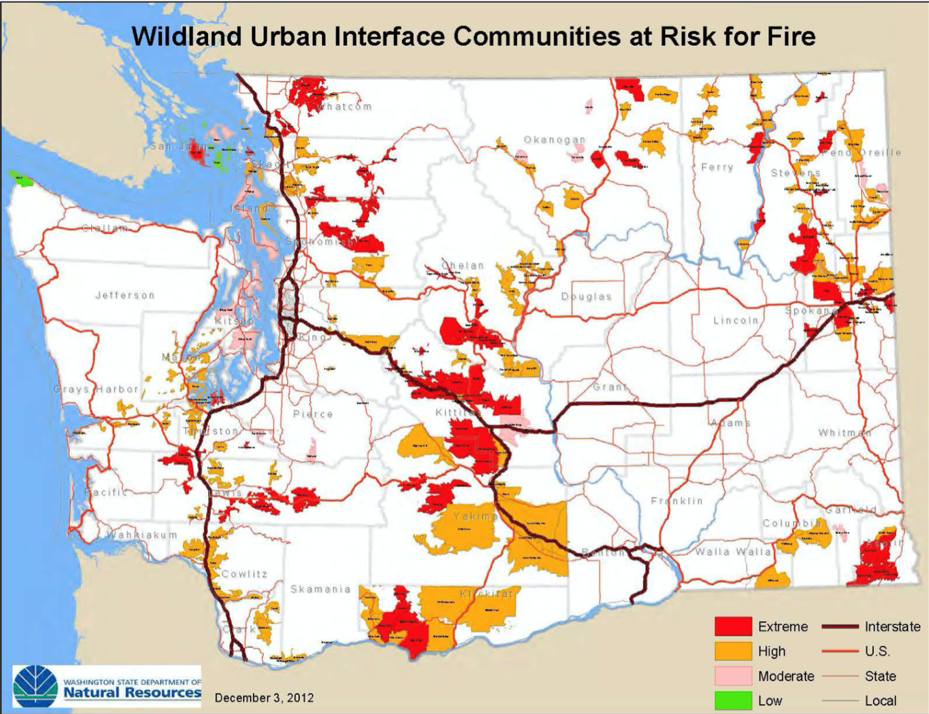 Urban areas with adjacent areas of wildfire fuel in Washington State as of 2012. Source: Washington State Hazard Mitigation Plan, map from the Washington State Department of Natural Resources. Human Consequences:The increase in wildfires in Chelan county poses a threat for residents and their surroundings. The Chelan Complex fire alone destroyed 58 buildings, causing $23,513,366.00 worth of damage. Economically, dealing with fires is very expensive. Between 2010 and 2016, Washington spent nearly a half a billion dollars fighting fires and maintaining fire departments. This imposes significant economic strain on all residents of Washington. Not only can people be affected by the economic repercussions of increasing wildfires, the rising threat means increased health risks as well. Though only a few wildfire deaths have been recorded in Chelan county, wildfire smoke increases the risk of respiratory and cardiovascular health issues. Smoke inhalation can also aggravate preexisting health conditions such as asthma and angina. People over the age of 65, children and infants, pregnant mothers, and people with lung, respiratory, and heart problems are all particularly susceptible to adverse effects. Though steps such as burn bans are being implemented in attempts to decrease the rate of wildfires in Chelan county, the decreasing precipitation and snow cover combined with the increasing heat means that forests are more at risk than ever, and forests at risk means that people are at risk. Further reading: Washington Forest Protection Association Rutgers University Global Snow Lab Climate Time Machine Earth Observatory Temperature, Precipitation, and Drought Article author: Gracie Camp, William O. Douglas Honors College, Central Washington University
Article editor: Dr. Tamara Caulkins, William O. Douglas Honors College, Central Washington University
5 Comments
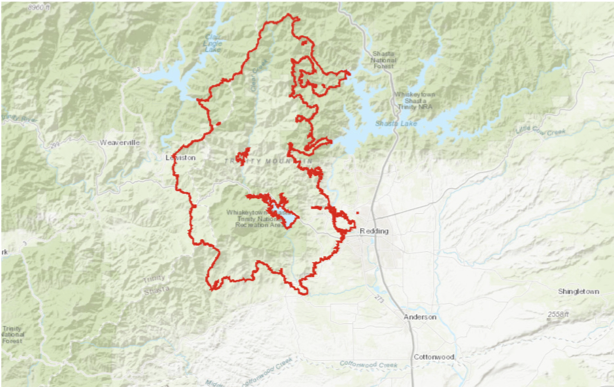 Regions burned in the 2018 Carr Fire in Shasta County. Source: CAL Fire Climate changes and the local environment: Shasta County in northern California is one of multiple areas in the state that has experienced the drastic social and physical effects of wildfires. In 2018 alone, there were millions of acres nationwide burned by wildfires and over 1 million of those acres were in California alone. Over 38,000 people were evacuated from the city of Redding, the Shasta county seat. Also in 2018, the town of Paradise just south of Shasta county in Butte county was almost completely destroyed. Climate change is a major factor in the prevalence of wildfires. Concurrent with the rise in average temperatures since the year 2000, eight out of the 10 biggest fires on record in California, have occurred. The state’s fire season is also longer, increasing from 65 days a year in the 1970s to 140 days in the 2000s. Some people may confuse wildfires with controlled fires that occur in many places across the nation. Controlled fires benefit the environment by allowing for new growth, killing diseases affecting local wildlife, and clearing the forest floor, among many other positive outcomes. Wildfires, in contrast, are unpredictable and often detrimental. In addition to destroying homes and animal habitats, wildfires have been known to release black carbon and greenhouse gases that have an adverse effect on air quality. 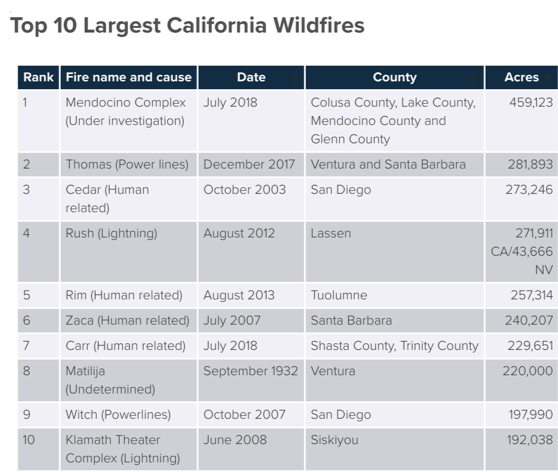 The Carr fire in Shasta and Trinity counties burned 220,651 acres, making it the seventh most destructive wildfire in California 2000. Source: Insurance Information Institute. How We Know: Across the state of California, the prevalence of wildfires has become rampant, especially in Shasta County. Although there are many local factors such the location of the fires, wind conditions, or form of ignition that can determine the effects of wildfires, there is a strong correlation between larger warming effects in the Western U.S. and acres burned with about 40% of the cause being attributed to warming among other factors, according to Carbon Brief. The same research also suggests a major connection between the increase in seasonal temperatures and the extent of fires since the 1980s. The increase in acreage burned by wildfires is consistent with global rising temperatures as a result of climate change. 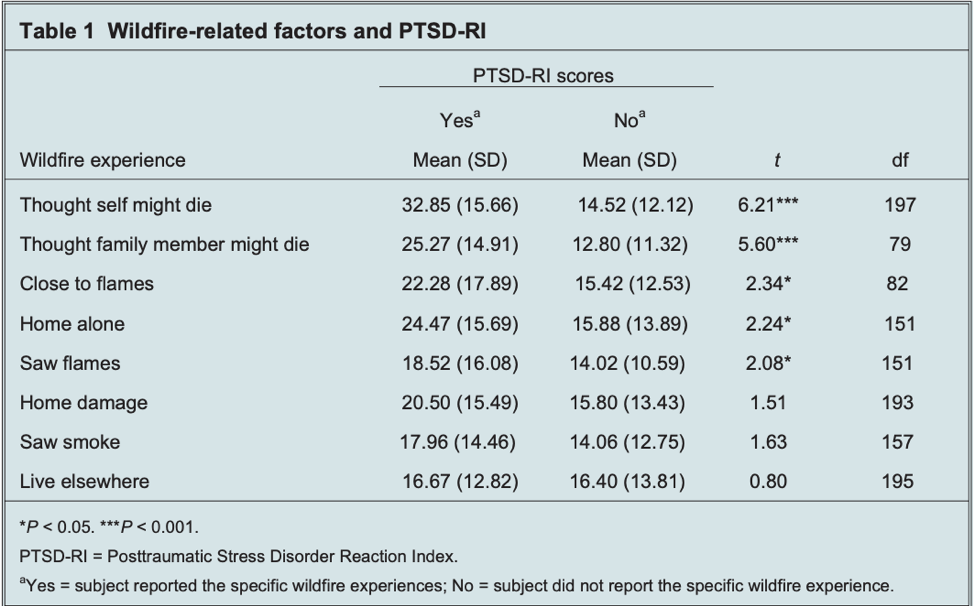 Traumatic events experienced by children and adolescents during local wildfires. Source: Canadian Journal of Psychiatry. Human Consequences: There are many effects that residents of Shasta County have experienced as a result of the increase in wildfires. As noted by the Shasta County Department of Resource Management, one of the more common results of wildfires is increased smoke exposure; this can be a major issue, especially for sensitive populations such as children, whose lungs are still in the process of development. In addition, children can be even more at-risk for detrimental effects of wildfires due to the extreme trauma that occurs during evacuations and witnessing the fires. Being displaced from home, watching communities burn, and evacuation stress are all causes of extreme emotional trauma for wildfire victims. Although children are not the only at-risk population affected by these disasters, they do require more care and attention than the average adult during an emergency. One area that especially affects older children is excessive exposure to media coverage. News coverage, while important for informing and educating people during emergencies, can cause anxiety, misunderstandings, and difficulties recovering emotionally for children with easy access to media sites. According to The National Child Traumatic Stress Network, exposure to both the natural disaster itself and the coverage post-incident can be detrimental to the wellbeing of children and families. Wildfires also can have a dramatic impact on local economies. Shasta County relies on tourism-related businesses surrounding Shasta Lake, Shasta Caverns, and the Shasta-Trinity National Forest. According to an article from Scientific American, the constant wave of fires throughout the summer season caused a 50% decrease in local rentals as well as less foot traffic at local shops. When the physical environment is almost unbearable for local residents, there is bound to be less tourism throughout the usual seasons. While it may seem that wildfires only cause physical destruction, there are also many human consequences that arise after a traumatic disaster. Further Reading: California Forward Forest Ecology and Management Insurance Information Institute U.S. Department of Agriculture USDA Forest Service Article Author: Madeline Wilson, William O. Douglas Honors College, Central Washington University
Article Editor: Dr. Tamara Caulkins, William O. Douglas Honors College, Central Washington University 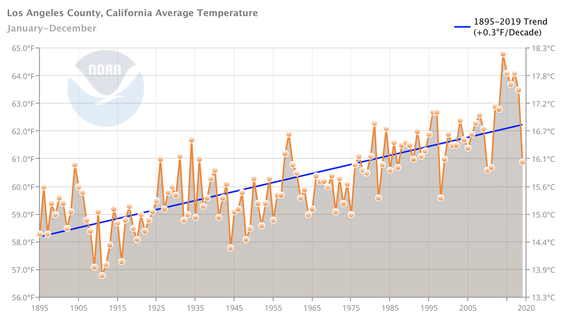 Average annual temperatures in Los Angeles County from 1895 to 2020. Source: NOAA Climate at a Glance. Climate changes and the local environment:Within the past century, the average temperature in Los Angeles County has increased by 3˚C. The number of days with a maximum temperature above 90˚ F has increased steadily over the past 20 years and is projected to continue rising. In addition to warmer average temperatures, Los Angeles County has experienced a decrease in precipitation during the fall and winter seasons. Increasing temperatures and decreasing levels of precipitation have increased the County’s risk for more severe droughts, as well as wildfires. 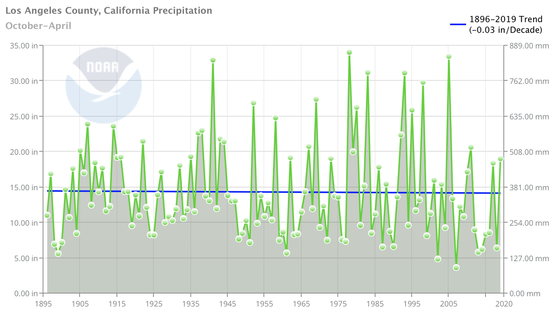 Average precipitation during the months of October to April in Los Angeles County from 1895 to 2020. Source: NOAA Climate at a Glance. Los Angeles County receives the majority of its annual rainfall during the late fall through early spring, then experiences a dry season during the summer months. The amount of winter season precipitation Los Angeles experiences has decreased over the past century, and this decline is predicted to continue. This reduction in rainfall means that there is less moisture in the soil at the beginning of the summer, which is the County’s dry season. The water evaporates from the soil and plants during the summer, and less winter precipitation ultimately leaves the vegetation drier earlier in the year. 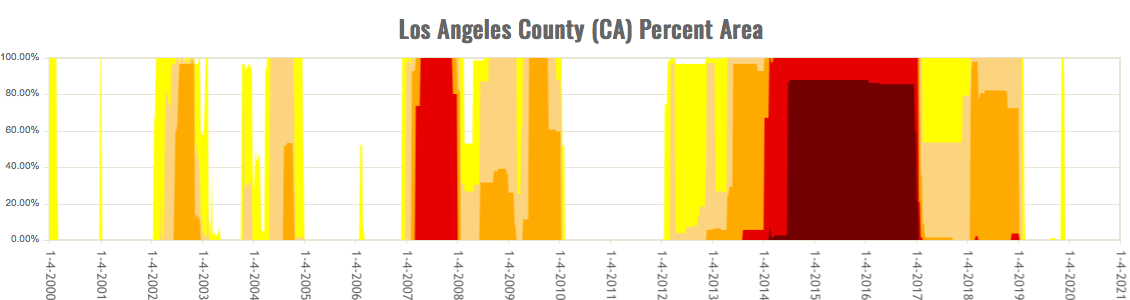 Drought severity in Los Angeles County from 2000 to 2020. Darker colors represent more severe droughts. Source: United States Drought Monitor. In addition to lower levels of rainfall, rising temperatures are reinforcing dryer and hotter summers in Los Angeles County. Higher annual temperatures lead to earlier snowpack melting, meaning that the winter season is shorter, there is less moisture in the soil during the dry season, and that the dry season is even longer. Warming temperatures also speed up evaporation, thus drying out the soil and parching the trees and vegetation. Drier and hotter summers have increased Los Angeles County’s drought risk, and by 2050 California’s risk of summertime drought is expected to almost triple. California’s dry and hot summers have always made the state more vulnerable to wildfires; however, rising temperatures and lower levels of precipitation have made the fire seasons longer and more severe. Los Angeles County’s fire season has already lengthened by approximately 75 days, and will likely increase in the future as well. With a longer and wetter winter season, Los Angeles County’s vegetation would soak up moisture which could help prevent summertime wildfires. This moisture dried out slowly through the summer season until it could be replenished the following fall. However, because the summer season has grown longer and hotter, and fall and winter rainfalls have decreased, flammable tinder has accumulated to high levels. Moreover, fire suppression over the last several decades has only added to the dangerous levels of tinder that has been available, and will continue to be available, to burn. How we know:These reconstructions are based on two easy to use tools that are freely accessible online: the National Oceanic and Atmospheric Administration (NOAA) Climate at a Glance tool and National Drought Mitigation Center's United States Drought Monitor. NOAA's Climate at a Glance tool uses data collected at weather stations and stored in NOAA's U.S. Climate Divisions database. This data is used to generate graphs about temperature, precipitation, and droughts, with the ability to look at global, national, and local averages. The Drought Monitor produces maps of drought conditions across the United States and publishes them weekly. The tool combines climate, soil, and water data with reports from 350 experts across the country. This generates an assessment of current drought conditions nationally, with the ability to look at data for individual states or counties. Human consequences:Warmer average temperatures, dryer seasons, and changing seasonal time frames have increased the number of wildfires in Los Angeles County, as well as in the intensity of the flames. Of the 20 largest fires to ever occur in California, two of them occurred in the last 10 years in Los Angeles County: the Thomas Fire in 2017 and the Station Fire in 2009. Over the past 50 years, summertime forest fires in the state have increased in size by approximately 800%, and 11.2 million residents in California currently live in areas with elevated risk for wildfires. Residents of Los Angeles County have already experienced the severe impacts of these wildfires. Wildfires release toxic smoke into the air, leaving dangerous air quality conditions, ash, and debris in their wake. Additionally, as wildfires rapidly spread, citizens can be forced to evacuate and in the worst situations, can lose their properties and homes to the fires. In 2018, the worst year of California wildfires on record, fires destroyed over 24,000 homes and buildings in the state. This increased risk of fire damage to residents’ homes has increased economic inequality in Los Angeles County, as wealth significantly enhances one’s possible response to wildfires. As early as 2005, wealthy individuals have been able to sign up for Private Fire Protection Services, typically at a high cost. While most individuals affected by fires were forced to flee their homes, wealthy individuals were able to wait out wildfires in luxury hotels while private firefighters worked to defend their properties from impending flames. This disparity was evident during the most recent Thomas Fire in 2017, when farm-owners left their properties to seek safety and returned to find their crops — and ultimately their livelihoods — destroyed. At the same time, many wealthy celebrities returned to their mansions on the beach, next-door to the farmers, with their properties untouched by the flames. Some climate activists have begun to refer to this emerging phenomenon as an impending “disaster apartheid.” As climate change continues to exacerbate wildfires and natural disasters become more frequent, there is a worry that a divide will form between “common” middle- and lower-class individuals and the wealthy elite. Los Angeles County will need to work especially hard in the near future to ensure that wealth does not drive a further wedge between its residents in the face of climate change. Further reading:California's New Normal: How the Climate Crisis is Fueling Wildfires and Changing Life in the Golden State. CNN California Wildfire Preparedness. States At Risk Why Does California Have So Many Wildfires? The New York Times Article Author: Benny Weisman, Georgetown University
Article Editor: Maddie Bowen, Georgetown University 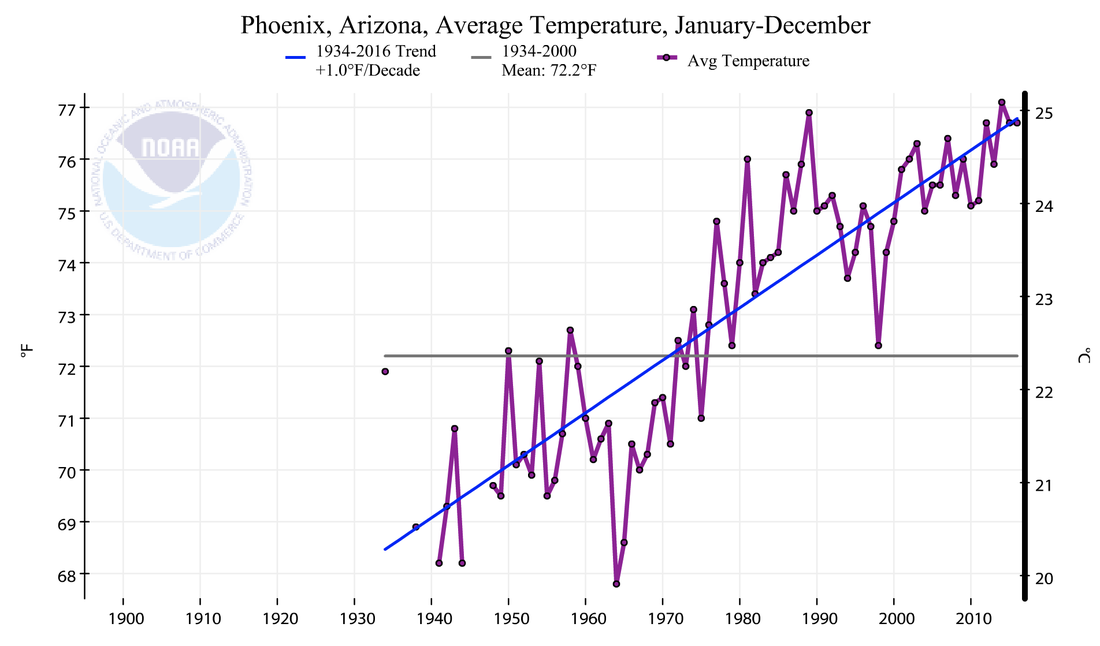 Average annual temperatures in Phoenix, the county seat of Maricopa County, 1935-2017. Source: NOAA Climate at a Glance. Climate changes and the local environment:Since 1970, average annual temperatures in Arizona have soared. In densely-populated Maricopa County, which includes Phoenix, average annual temperatures have risen by over 7° F (nearly 4° C), which is roughly four times the global average. In no major U.S. city have temperatures climbed more quickly. This remarkable rise has sharply increased the frequency of particularly extreme weather. In the summer of 2017, for example, a heat wave sent temperatures soaring to over 120° F (nearly 50° C). Summer days with relatively cool temperatures, by contrast, have grown scarce. From June to September 2017, only 14 days had high temperatures lower than 100° F. Higher temperatures have increased rates of evaporation across Arizona, and therefore dried much of the state. Average annual precipitation in Maricopa County has actually increased slightly over the past century, yet precipitation in mid to late summer has declined substantially. Summer droughts have therefore become common in Maricopa County. Warming, drying trends have created ideal conditions for wildfires across Arizona, including in Maricopa County. Wildfires in Arizona have therefore grown more frequent, and they last longer. In spring 2017, a wildfire in Maricopa County’s Tonto National Forest consumed some 500 acres of woodland. 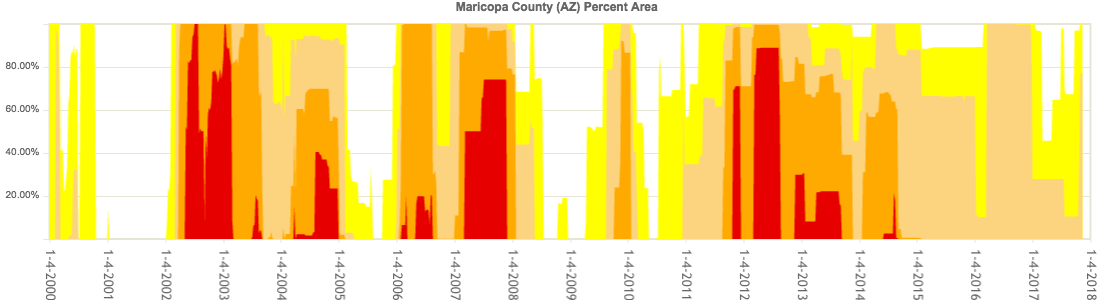 Drought severity in Maricopa from 2000 until 2017. Darker colors represent worse droughts; higher values mean more of the county was in drought. Source: United States Drought Monitor. How we know:These reconstructions are largely based on reliable, easy to use tools that are freely accessible online: the National Oceanic and Atmospheric Administration (NOAA) State Annual and Seasonal Time Series, the NOAA Climate at a Glance app, the National Drought Mitigation Center's United States Drought Monitor. NOAA's State Annual and Seasonal Time Series and Climate at a Glance tools use data collected at weather stations and stored in NOAA's U.S. Climate Divisions database. The Drought Monitor compiles weekly maps of drought conditions across the United States, and combines climate, soil, and water data with reports from 350 experts across the country. 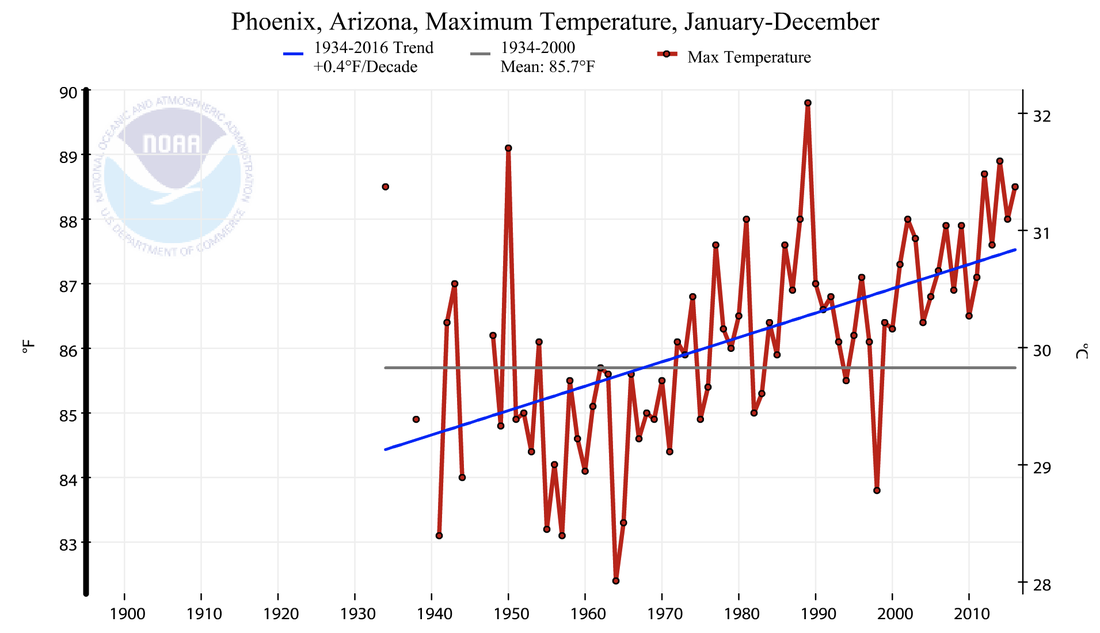 Average daily maximum air temperature in Phoenix, 1934-2017. Source: NOAA Climate at a Glance. Human consequences:Rising summer temperatures in Arizona have increased the number of heat-related deaths in Maricopa County. Especially hot, dry weather can provoke dehydration and heat stroke, and can interfere with cardiovascular, respiratory, and nervous systems. The very old, the very young, and the sick are especially vulnerable, particularly in poor neighborhoods where some households might not have dependable access to air conditioning. Employees who spend most of their time outside - such as construction workers - are also at risk. Heat-related threats to human health can be especially great in cities like Phoenix, where paved surfaces create urban heat sinks that amplify hot temperatures. In 2016, Maricopa County endured 130 heat-related deaths, the most in the last 15 years. On average, Arizona hospitals now treat almost 2,000 patients per year for heat-related illnesses. Many injuries and deaths not only reflect warming trends, but also social and infrastructural problems that make it hard for people to escape the heat. Wildfires in Arizona, including in Maricopa County, have also proven costly for state and federal governments. Containing the Arizona wildfires has cost many millions of dollars, and the total costs of wildfires can exceed suppression costs by more than 30 times. In Maricopa County, smoke billowing from fires in Tonto National Forest, for example, shut down Bush Highway. Foresters have conducted controlled burns to limit the future risk of major wildfires in the forest, but prolonged drought has foiled some of these efforts. In Phoenix, the municipal government has taken steps to lower the city's contribution to climate change. It has expanded public transit, constructed new bike lanes, purchased electric vehicles, installed low-energy bulbs in street lighting, and set ambitious goals for cutting greenhouse gas emissions. Still, adapting to climate change has proven to be an even more daunting task, especially for the city's less affluent residents. Further reading:A Building Boom and Climate Change Create an Even Hotter, Drier Phoenix. LA Times Phoenix Will Be Almost Unlivable by 2050 Thanks to Climate Change. Vice Article author: Luke Powers, Georgetown University
Article editor: Dr. Dagomar Degroot, Georgetown University 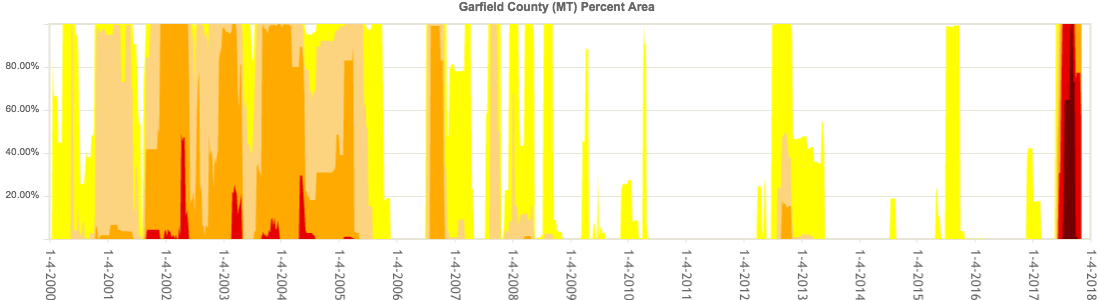 Drought severity in Garfield County from 2000 until 2018, showing the drought of 2017. Darker colors represent worse droughts; higher values mean more of the county was in drought. Source: United States Drought Monitor. Climate changes and the local environment:Over the past century, average annual temperatures have soared across Montana, rising by almost 2° C (3° F) relative to twentieth-century averages. Warming has shortened winters, and earlier thawing has prevented snow from accumulating. Hotter spring, summer, and fall temperatures have also increased the rate of evaporation across Montana. Average annual precipitation in Montana has increased modestly. However, rainfall has only increased in the early spring and late fall, and precipitation in the summer has actually become more scarce. The summer dry season is therefore drier and longer than it once was. Extreme droughts are now much more likely to occur than they once were. Together, these changes have created ideal conditions for wildfires in heavily forested but sparsely populated Garfield County, Montana. In the summer of 2017, no fewer than 21 wildfires broke out in Montana during a particularly severe, long-lasting drought. Together, the wildfires consumed nearly 1.3 million acres of forest, and two fires alone each burned across over 100,000 acres. National data suggests that climate change, not shifting forest management practices, were responsible for the 2017 wildfires in Garfield county. Beginning in the 1980s, large wildfires across the United States suddenly grew more common, and lasted longer, especially in regions lightly touched by forest management practices. Almost everywhere, rising spring and summer temperatures, and an earlier spring snowmelt, were largely to blame. By burning through old trees and brush, wildfires can bring new life to a forest, making way for diverse plant species and creating new habitats for animals. Yet the dramatic increase in the frequency, scale, and length of wildfires in Montana has interfered with the ability of forests to recover. 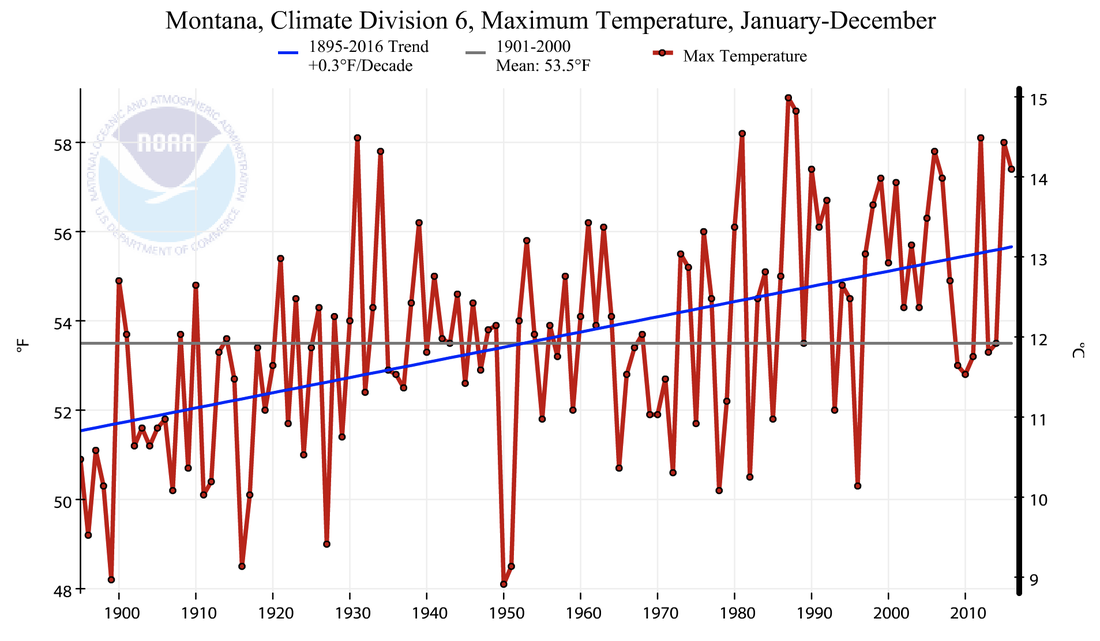 Average daily maximum air temperature in northeastern Montana, 1895-2017. Source: NOAA Climate at a Glance. How we know:These reconstructions are largely based on reliable, easy to use tools that are freely accessible online: the National Oceanic and Atmospheric Administration (NOAA) State Annual and Seasonal Time Series, the NOAA Climate at a Glance app, the National Drought Mitigation Center's United States Drought Monitor. NOAA's State Annual and Seasonal Time Series and Climate at a Glance tools use data collected at weather stations and stored in NOAA's U.S. Climate Divisions database. The Drought Monitor compiles weekly maps of drought conditions across the United States, and combines climate, soil, and water data with reports from 350 experts across the country. These reconstructions also draw on visualizations provided by the National Interagency Fire Center, which has created a tool that predicts the potential of new wildfires based on previous weather conditions. They also rely on an important 2006 study in the journal Science, which finds clear links between warming and wildfires. 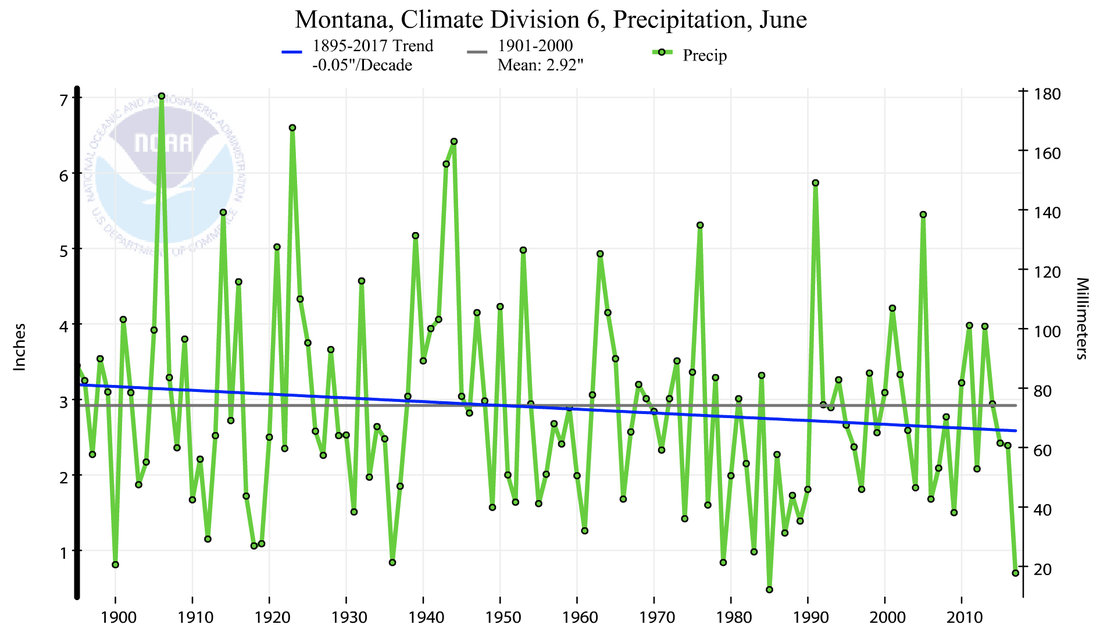 Average June precipitation in northeastern Montana, 1895-2017. Source: NOAA Climate at a Glance. Human consequences:In recent decades, the environment of Garfield County has grown more dangerous for its human residents. In 2017, the Lodgepole wildfire spread into Garfield County and eventually consumed an area the size of New York City. After billions of dollars were spent to control the fire, and two firefighters lost their lives, the county nevertheless lost over 20 buildings. Meanwhile, drought and wildfires have together undermined cattle ranching, a staple of Montana's economy and culture. Fires not only destroyed grazing land and killed cattle, but also incinerated nearly 2,300 km (1,300 miles) of fencing, and required costly hay imports. Some ranchers have had to sell cattle in huge quantities because there is no more grazing land to support them, and many ranchers will lose "genetics" that have taken years to hone. Young ranchers have seen their businesses ruined before they ever got off the ground. 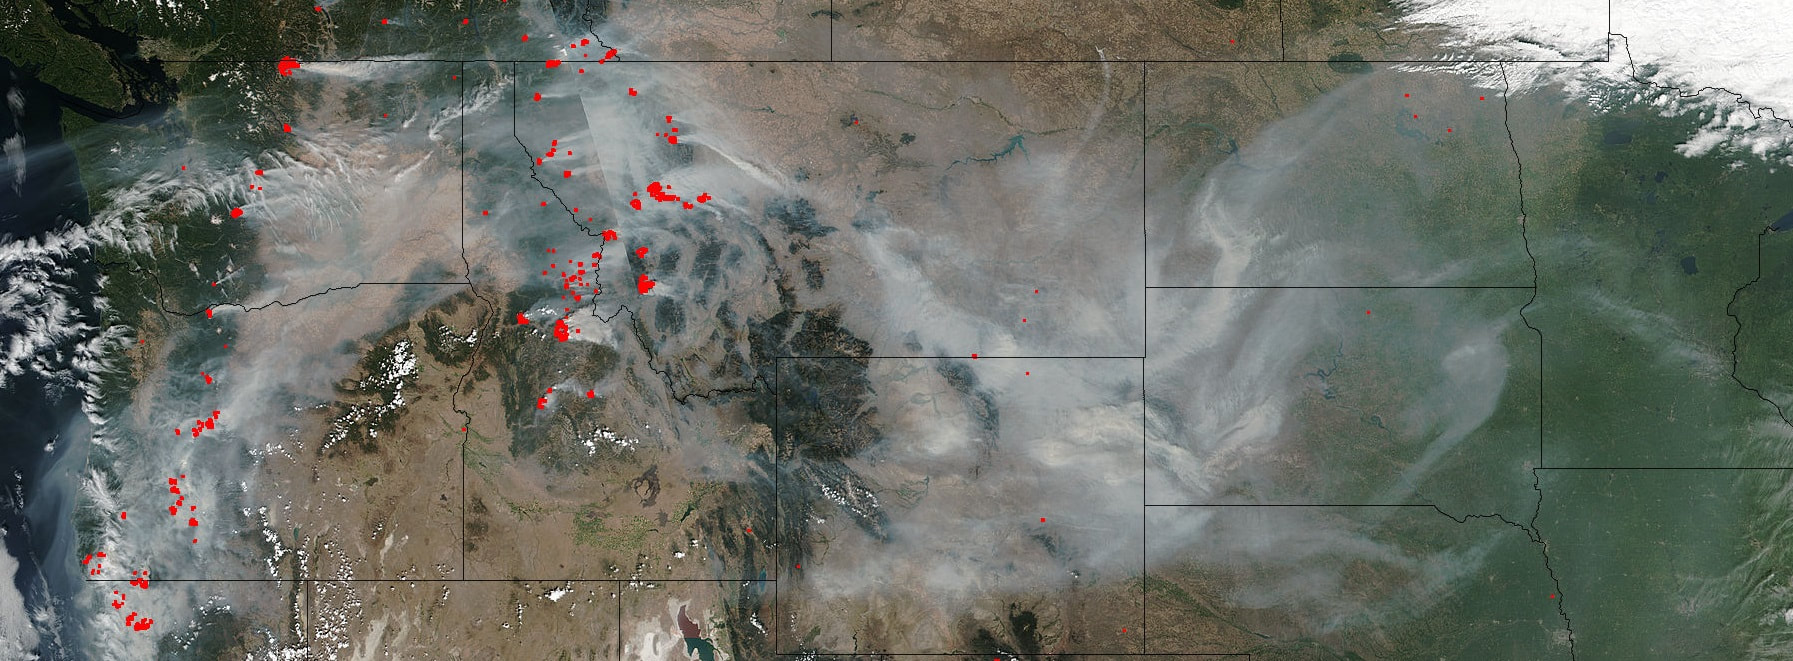 A satellite image of wildfires across the western United States in summer, 2017. Source: NASA The destructiveness of the 2017 wildfires have provoked renewed debate about logging in the forests of Montana. Advocates insist that logging reduces the risk of forest fires and spurs Montana's economy. Skeptics point out that although millions of acres of forest have been cleared of dangerous fire "fuels" - including in Garfield County - wildfires nevertheless burned uncontrollably. Droughts worsened by climate change have overwhelmed local attempts to confront wild fires. Further reading:Long-term Losses of Montana's Fire Season Amount to Much More than Scorched Grass. Billings Gazette Montana Wildfires Reignite Logging Debate. NPR Wildfire Myths: Logging the Forest Won’t Save It. Counter Punch Garfield County Community Wildfire Protection Plan. Walsh Environmental Scientists and Engineers, LLC Article author: Sabine Neschke, Georgetown University
Article editor: Dr. Dagomar Degroot, Georgetown University 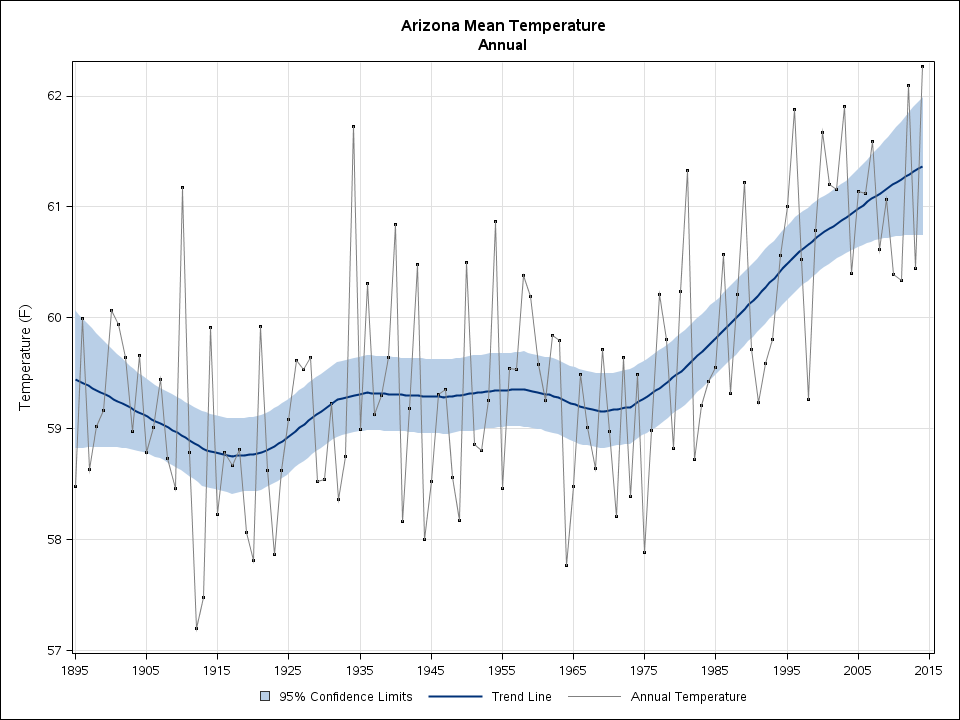 Mean annual temperatures in Arizona since 1895. Source: NOAA State Annual and Seasonal Time Series. Climate changes and the local environment:Mohave County is located in Northwestern Arizona, and includes part of the Grand Canyon National Park, as well as several federally recognized Native American Reservations. Its annual average temperatures have risen by an average of 0.2°F per decade between 1895 and 2016. However, this average hides the fact that average temperatures in the county and the state were mostly stable until roughly 1975. After that year, the trend in average temperatures began rising very quickly, and this caused a worrying increase in the frequency and intensity of wildfires and droughts. These weather and climate-related events have had devastating effects in the local environment. As much as 15 per cent of Arizona is covered by national forests, and the hotter and drier conditions have made it easier for wildfires to occur. According to U.S. Forest Service records, large wildfires (of more than 1,000 acres) in the state have increased from approximately 5 per year before 1980, to a current average of near 20. Drought has affected the Colorado river, a source of water for over 30 million people, including a large share of Mohave County and the State of Arizona. For example, the Upper Colorado Basin has seen more common and severe droughts in the last 50 to 90 years. In the period between 2000 and 2014, the river’s flow declined by 19 per cent compared to the average between 1906 and 1999. Researchers have estimated that warmer temperatures account for up to one-sixth of these losses, which are approximately equal to enough water to support 1 million households for a year. 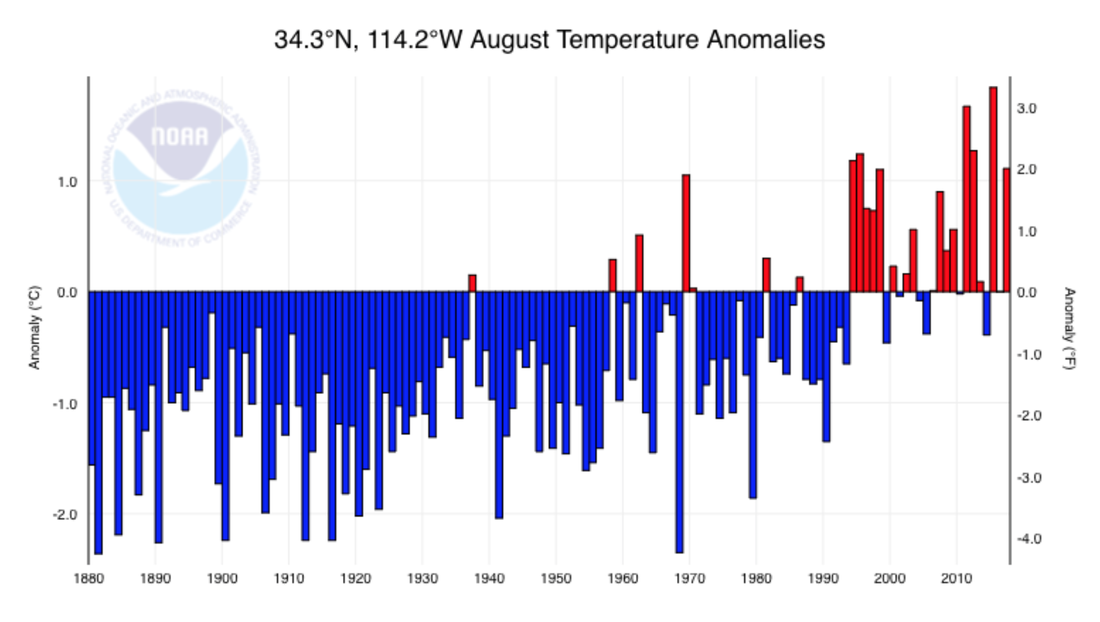 Since the 1990s, Lake Havasu City, a city in Mohave County that borders with Southern California, has seen average temperatures in August that are much higher than the long-term average for that month. Source: NOAA. How we know:These climate and weather reconstructions are based on several tools made available online by several United States agencies, such as the National Oceanic and Atmospheric Administration (NOAA)’s State Annual and Seasonal Time Series. This site is useful to see the evolution of temperatures at the state level since 1895, and its information is obtained from the U.S. Climate Divisional Dataset, used often for agricultural matters. NOAA’s Climate at a Glance tool is intended for studying the changes and variability of climate, and has adjusted the data to take into account artificial effects that affect climate, such as urbanization. Another important resource is the United States Drought Monitor, which develops weekly maps of drought conditions across the country, and uses climate, soil, and water data, together with reports from 350 experts across the country. The U.S. Climate Resilience Toolkit helps people become informed about their risks and opportunities related to the changing climate, and to help them become more resilient. One of its tools is the Climate Explorer, which allows users to explore the potential damaging effects of climate on the population and their valued possessions, such as land and crops. To do this, it shows projections of temperatures, precipitation, and others for two possible futures: one in which humans make a moderate attempt to reduce their carbon emissions, and another in which humans continue to act as usual. 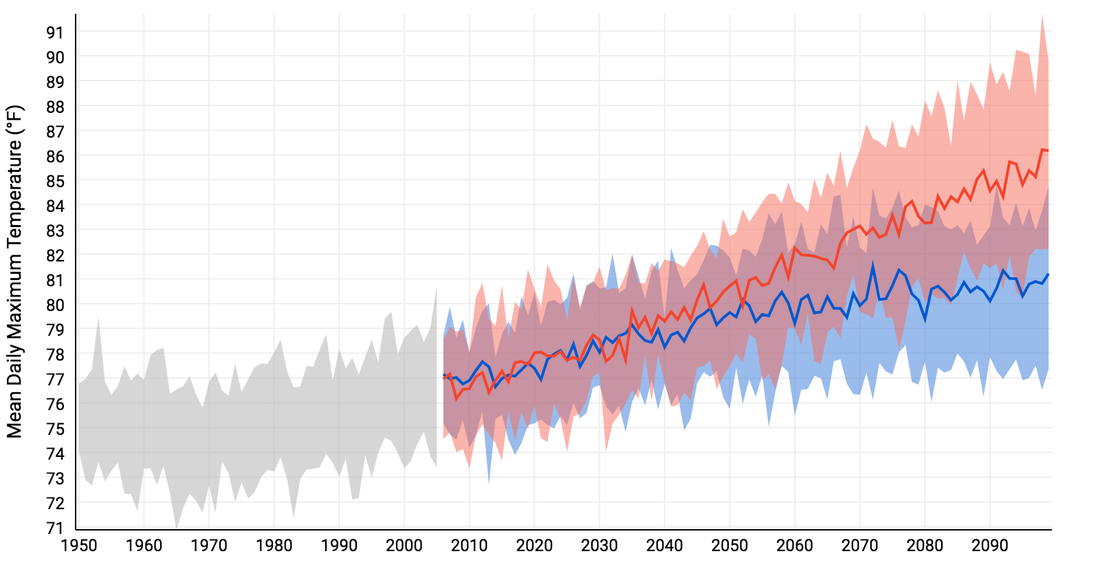 Average daily maximum temperatures in Mohave County, Arizona. Grey shows the historical trend since 1950. Red shows the projection for a future with higher emissions, and blue with lower emissions. Source: NOAA U.S. Climate Resilience Toolkit (Climate Explorer). Some of the biggest effects of climate change in Arizona have been linked to health concerns, disruptions in the water supply for farms and cities, and the destruction of the environment with wildfires. In the summer of 2017, the state made nationwide news when numerous flights were cancelled in Phoenix due the excessive heat. These extreme temperatures caused near 1,300 deaths between 2005 and 2015, and the number of heat-related illnesses has been increasing, according to a medical director at the Banner University Medical Center in Phoenix. The Environmental Protection Agency (EPA) has reported that more than 2 per cent of the land in Arizona has burned per decade since 1984, and the smoke produced often damages the quality of the air and water, and creates health problems for the population. In Mohave County, the most significant human consequences of climate change can be found in the water supply disruption to households, and in the Native American communities. Decreasing water reserves in important bodies of water like Lake Mead, and the increasing water needs due to growing cities and new farms that move from California’s even more extreme water shortage, have led to severe concerns and restrictions on water use. Native American tribes have seen their traditional practices challenged, as they are typically very dependent on agriculture and the raising of livestock, which in turn depend on weather and the availability of water. For the Mohave tribe, a drier Colorado River means a disruption to their traditions, as they believe that the river was created by their ancient deity Mastamho as part of their sacred landscape. Despite this worrisome picture, in a Climate Central report, Arizona’s government received a failing grade for its average level of wildfire preparedness, and a near-failing grade for its drought preparedness, as its plans do not account for the devastating effects of climate change. Further reading:The Future is Drying Up. NY Times Magazine Where the River Runs Dry. The New Yorker The $2.4 Billion Plan to Water California by Draining the Mojave. Wired Wildfires, Once Confined to a Season, Burn Earlier and Longer. NY Times Article author: Alejandro Carrera Rodriguez, Georgetown University
Article editor: Dr. Dagomar Degroot, Georgetown University 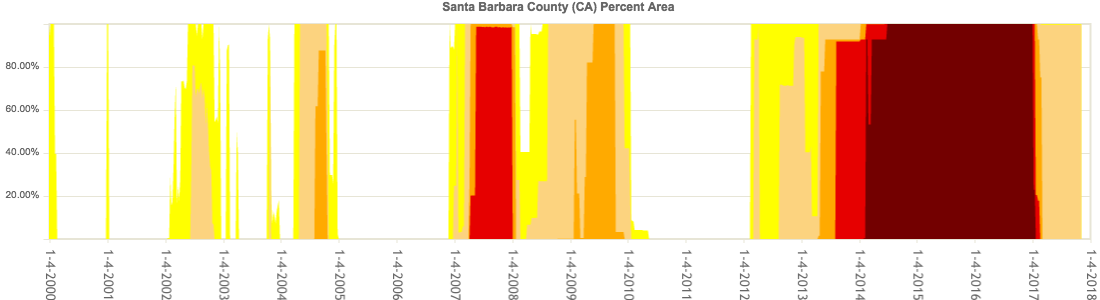 Drought severity in Santa Barbara County from 2000 until 2017, showing the landmark drought of 2014-2017. Darker colors represent worse droughts; higher values mean more of the county was in drought. Source: United States Drought Monitor. Climate changes and the local environment:Average annual temperatures across California have been rising since the nineteenth century, a trend that has sharply accelerated since around 1970. Average temperatures across all seasons in Tulare County in south central California have mirrored that statewide pattern. As the county warmed, it suffered a series of severe droughts, which are usually defined as long-lasting moisture deficits that have environmental and social consequences. Droughts in the county involve three sources of water: surface water at low elevations, snow at high elevations, and groundwater buried below the surface. Precipitation in much of California has long varied by as much as 50% from year to year. Hotter temperatures, however, are increasing the rate of evaporation across California, including in Santa Barbara County. That has affected both mountain snow and lowland liquid water, and has made local droughts even longer and drier than they once were. One of the most severe droughts in the county's history recently began in February 2012 and lasted into 2017. The driest stretch of the drought started in February 2014 and endured until January 2017. It was part of a broader Californian drought that started in coastal areas several years earlier, and was up to 27% more likely to occur in our warmer climate. Longer, drier summers and an earlier snowmelt have caused drier forest conditions in southwest California, which has increased the amount of available kindling for wildfires to consume. These conditions have increased the size and duration of wildfires in California, and dramatically lengthened the wildfire season in Santa Barbara county. How we know:These reconstructions rely on several easy to use tools that are available online: the National Oceanic and Atmospheric Administration (NOAA) State Annual and Seasonal Time Series, the NOAA Weekly Palmer Drought Indices, the National Drought Mitigation Center's United States Drought Monitor, and the United States Geological Survey (USGS) interactive website. NOAA's State Annual and Seasonal Time Series relies largely on weather station measurements. NOAA's Palmer Drought Indices use a standard way of measuring drought that considers both water supply and demand in a soil moisture model. Negative values represent droughts, and positive values represent wet conditions. The United States Drought Monitor uses a number of drought indicators, including the Palmer Drought Indices, that consider both environmental and social manifestations of water shortages. The interactive tools made available by the USGS draw on open data provided by a range of United States government agencies, including the Army Corps of Engineers and the Bureau of Reclamation. 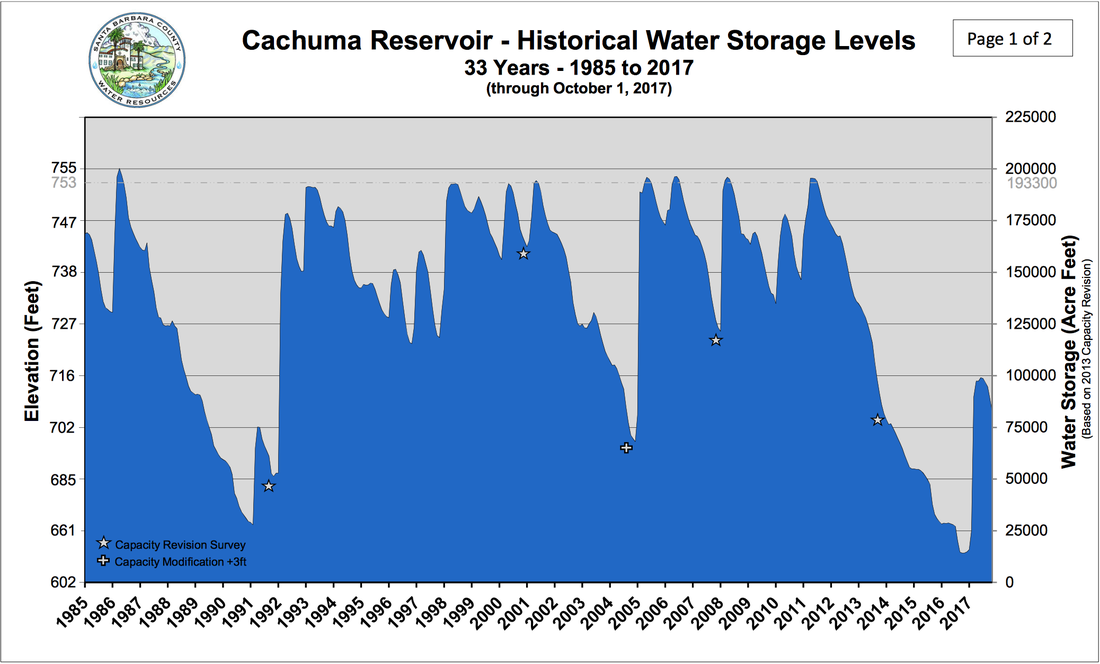 Water levels in Cachuma reservoir responded to the Californian drought. Human consequences:Droughts can sharply reduce the quantity of water in reservoirs and aquifers across California, which often supply water to local residents. Reservoirs, which collect precipitation, and aquifers, which are the groundwater storage spaces, both contribute to Santa Barbara’s water supply. This supply is crucial for both commercial and industrial use. If global warming continues, Santa Barbara’s premium wine industry could be significantly affected. This is because distinct grape species can only thrive in specific temperature ranges. If Santa Barbara fails to produce grapes that can tolerate higher temperatures, then the decline in suitable land could be up to 20%. Wine is currently the third-most produced commodity in Santa Barbara county, and wine sales comprise nearly a tenth of the county's economy. One of the main water sources that supplies residents in Santa Barbara county is the Lake Cachuma reservoir. The reservoir supplies 85 percent of the water supply for over 250,000 residents of Goleta district in Santa Barbara county. Its available water supply plummeted during the California drought. As of October 1st 2017, it is still only 43% full. The lack of water in the Cachuma reservoir, in conjunction with the drought, will force Santa Barbara county to search for alternative water sources. Just recently, the county decided to reopen its desalination plant to supply more water to their residents. The reactivation of this plant cost the county an estimated $71 million, not including the cost of maintaining the plant. It will supply 3 million gallons of water per day to residents to cover 30% of the city’s water usage. In a warmer and drier future, such desperate measures may well be necessary across California. Article author: Madeline Lee, Georgetown University
Article editor: Dr. Dagomar Degroot, Georgetown University |
 RSS Feed