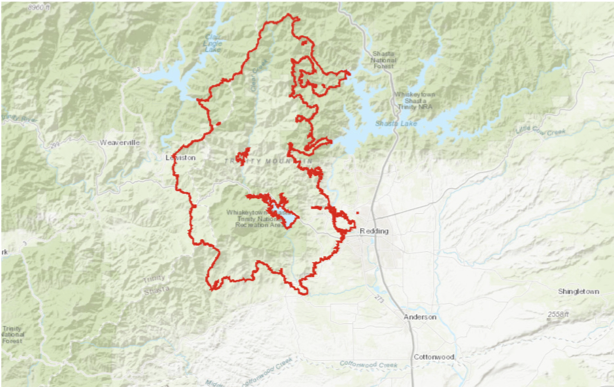
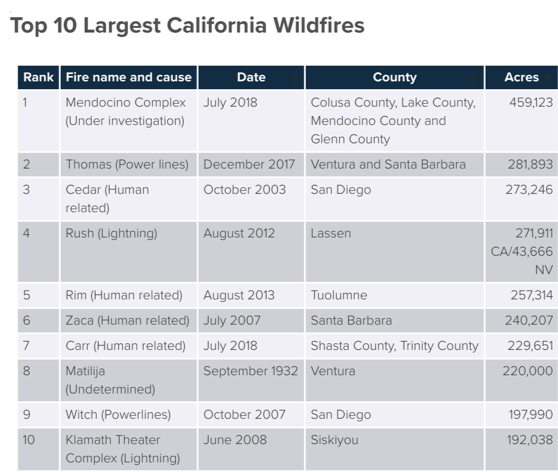
Climate changes and the local environment: Shasta County in northern California is one of multiple areas in the state that has experienced the drastic social and physical effects of wildfires. In 2018 alone, there were millions of acres nationwide burned by wildfires and over 1 million of those acres were in California alone. Over 38,000 people were evacuated from the city of Redding, the Shasta county seat. Also in 2018, the town of Paradise just south of Shasta county in Butte county was almost completely destroyed. Climate change is a major factor in the prevalence of wildfires. Concurrent with the rise in average temperatures since the year 2000, eight out of the 10 biggest fires on record in California, have occurred. The state’s fire season is also longer, increasing from 65 days a year in the 1970s to 140 days in the 2000s. Some people may confuse wildfires with controlled fires that occur in many places across the nation. Controlled fires benefit the environment by allowing for new growth, killing diseases affecting local wildlife, and clearing the forest floor, among many other positive outcomes. Wildfires, in contrast, are unpredictable and often detrimental. In addition to destroying homes and animal habitats, wildfires have been known to release black carbon and greenhouse gases that have an adverse effect on air quality. How We Know: Across the state of California, the prevalence of wildfires has become rampant, especially in Shasta County. Although there are many local factors such the location of the fires, wind conditions, or form of ignition that can determine the effects of wildfires, there is a strong correlation between larger warming effects in the Western U.S. and acres burned with about 40% of the cause being attributed to warming among other factors, according to Carbon Brief. The same research also suggests a major connection between the increase in seasonal temperatures and the extent of fires since the 1980s. The increase in acreage burned by wildfires is consistent with global rising temperatures as a result of climate change. Human Consequences: There are many effects that residents of Shasta County have experienced as a result of the increase in wildfires. As noted by the Shasta County Department of Resource Management, one of the more common results of wildfires is increased smoke exposure; this can be a major issue, especially for sensitive populations such as children, whose lungs are still in the process of development. In addition, children can be even more at-risk for detrimental effects of wildfires due to the extreme trauma that occurs during evacuations and witnessing the fires. Being displaced from home, watching communities burn, and evacuation stress are all causes of extreme emotional trauma for wildfire victims. Although children are not the only at-risk population affected by these disasters, they do require more care and attention than the average adult during an emergency. One area that especially affects older children is excessive exposure to media coverage. News coverage, while important for informing and educating people during emergencies, can cause anxiety, misunderstandings, and difficulties recovering emotionally for children with easy access to media sites. According to The National Child Traumatic Stress Network, exposure to both the natural disaster itself and the coverage post-incident can be detrimental to the wellbeing of children and families. Wildfires also can have a dramatic impact on local economies. Shasta County relies on tourism-related businesses surrounding Shasta Lake, Shasta Caverns, and the Shasta-Trinity National Forest. According to an article from Scientific American, the constant wave of fires throughout the summer season caused a 50% decrease in local rentals as well as less foot traffic at local shops. When the physical environment is almost unbearable for local residents, there is bound to be less tourism throughout the usual seasons. While it may seem that wildfires only cause physical destruction, there are also many human consequences that arise after a traumatic disaster. Further Reading: California Forward Forest Ecology and Management Insurance Information Institute U.S. Department of Agriculture USDA Forest Service Article Author: Madeline Wilson, William O. Douglas Honors College, Central Washington University
Article Editor: Dr. Tamara Caulkins, William O. Douglas Honors College, Central Washington University
3 Comments
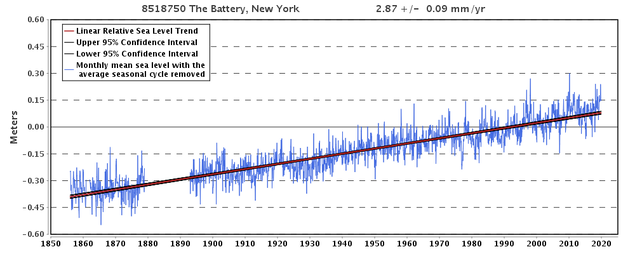
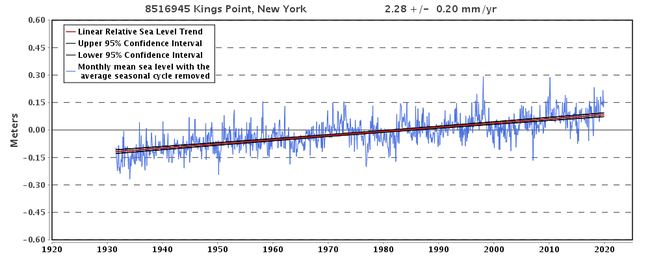
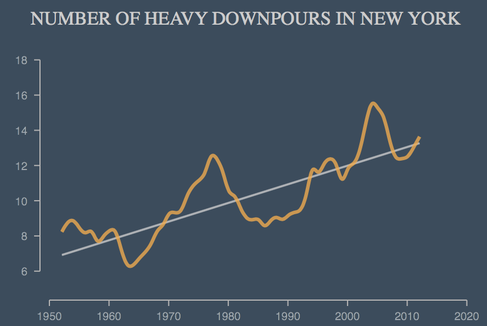
Climate changes and the local environment:For coastal communities such as New York City, global warming is a particularly pressing threat and its effects have already been experienced. Over the past century, the concentration of greenhouse gases in the atmosphere has increased, thus raising the global average temperature. With temperatures rising, sea levels rise as well. Global sea level rise can be attributed to two main factors: Arctic ice caps are melting, and oceans are warming thus expanding in volume. Rising sea levels have left New York City vulnerable to floods and storm surges. Historically, one important line of defense for these coastal areas have been salt marshes, which are estuaries where fresh and saltwater mix. Jamaica Bay is an estuary that can be found in the highly urbanized intersection between the Brooklyn and Queens boroughs, and is particularly valuable for both the humans and the natural environment. During the last one hundred years alone, local sea levels have risen by nearly 30cm in New York City, with the rate of sea level rise in Jamaica Bay being almost twice the mean global rate. These two graphs, taken from NOAA’s Tides and Currents website, depict historic sea level is rise in Kings Point and The Battery in New York City. This data can be used to extrapolate the changes in sea level for Jamaica Bay, due to their proximity and similar conditions to the salt marsh. Salt marshes like Jamaica Bay provide some protection from the effects of sea level rise by slowing wave velocity, absorbing excess rainwater, and mitigating storm surges. They also protect shorelines from erosion by buffering wave action and trapping sediments. Additionally, they provide numerous other ecological benefits such as high biodiversity, improved water quality, flood reduction, and carbon sequestration. In addition to contributing to sea level rise, warming temperatures lead to an increase in evaporation, and thus, an increased frequency in storm events. Higher sea levels and storm events work synergistically – the greater the sea level rise, the more flooding each storm will bring, as well as more wave intensity and greater erosion. With New York City seeing a 350% increase in heavy downpours since 1950, marshes like those in Jamaica Bay have become increasingly vulnerable to erosion and floods from these worsening storms. How we know:This information relies on data from easily two accessible online tools, including the National Oceanic and Atmospheric Administration (NOAA) Tides and Currents tool and Climate Central’s Surging Seas: Risk Finder projections. It also uses data from a Climate Central research report. The NOAA Tides and Currents resource reports local mean sea level changes from 1850 to today. It uses data collected from U.S. and global water level stations to reconstruct local sea level trends. Climate Central’s Surging Seas tool generates projections for sea level rise and flood risks, which are based on the different emissions scenarios presented in the NOAA Technical Reports. The tool additionally shows the floods that coastal locations have experienced, distinguishing between which floods are driven by climate-linked sea level rise and which would have occurred naturally. Climate Central’s Heaviest Downpours research report displays the increase in heavy downpours in the United States. At each station, a heavy downpour was defined as the top 1 percent daily precipitation amounts over the period from 1950 to 2014. The analysis is based on precipitation observations from 2,962 climate stations across the US. Human consequences:While salt marshes can be quite resilient to sea level rise, Jamaica Bay experiences a variety of other stressors that make it particularly vulnerable to this threat. Factors that exacerbate the already damaging effects of sea level rise include the general sediment deficit, a deepening of the Bay through dredging, waves generated by boat traffic, and excessive waterfowl grazing. While in less metropolitan areas, salt marsh loss can be compensated for by expanding the marsh onto adjacent upland or freshwater zones, Jamaica Bay shows the catastrophic repercussions of deteriorating salt marshes that have no hopes for expansion. Salt marshes in New York are one of the primary defenses against rising sea levels for coastal areas, but have been steadily deteriorating throughout the last several centuries. In New York State, salt marshes have reduced by 60% from 1780 to 1980. Field studies conducted in Jamaica Bay show that from 1989 to 2003, the Bay’s marshes were in rapid decline losing 13.4 ha/year. From 2003 to 2013, this has declined to 2.1 ha due to restoration efforts. While the expected rising sea levels and future storms provide significant cause for concern, particularly in the Jamaica Bay region, this estuary is also a fascinating example of resilience in the face of climate change. In 2012, Hurricane Sandy tore through the northeast, causing significant flooding and massive devastation to infrastructure and coastal lagoons in the New York City area. During Hurricane Sandy, Jamaica Bay experienced a storm surge of 8 to 10 feet during the worst of the storm. The damage felt after the storm was significant as well, with debris from destroyed homes and buildings coming from Queens and Brooklyn ultimately ending up in the Bay. Additionally, thousands of gallons of oil coming from home fuel tanks leaked into the area, creating yet another expense in the clean up after the storm. The massive damages that Jamaica Bay, and the New York region as a whole, experienced from Hurricane Sandy displayed how instrumental proper governance and human action are in dealing with natural emergencies. Disaster relief funds provided swift critical aid to the region; however, many of these efforts were contained to the short-term and were more of a response tactic, rather than a preventative measure. Despite the destruction New York City faced in 2012, human efforts have caused impressive improvement in the conditions of Jamaica Bay within the last two decades. Compared to 2003 when restorations first began, there has been a marked decrease in deterioration for the Bay. This ultimately was responsible for how swiftly the area recovered after Hurricane Sandy; however, constant monitoring is necessary, as even post-restoration, salt marsh loss continues to occur in the Bay. Considering how important Jamaica Bay has historically been for the economic, social, and ecological health of New York, it is imperative that a concerted effort be made to help inoculate this area from the threats of future climate change, as rising sea levels and stronger storms will likely increase the risks facing the region. Further reading:Five Years After Hurricane Sandy, NYC’s Coastal Communities Remain Vulnerable. Curbed New York Jamaica Bay Walloped by Hurricane Sandy. Queens Chronicle New York Today: A ‘Maritime Forest’ Where Sandy’s Waters Rose. New York Times Article Author: Nicole Sheynin, Georgetown University
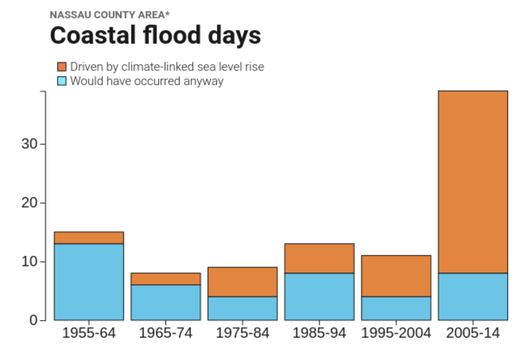
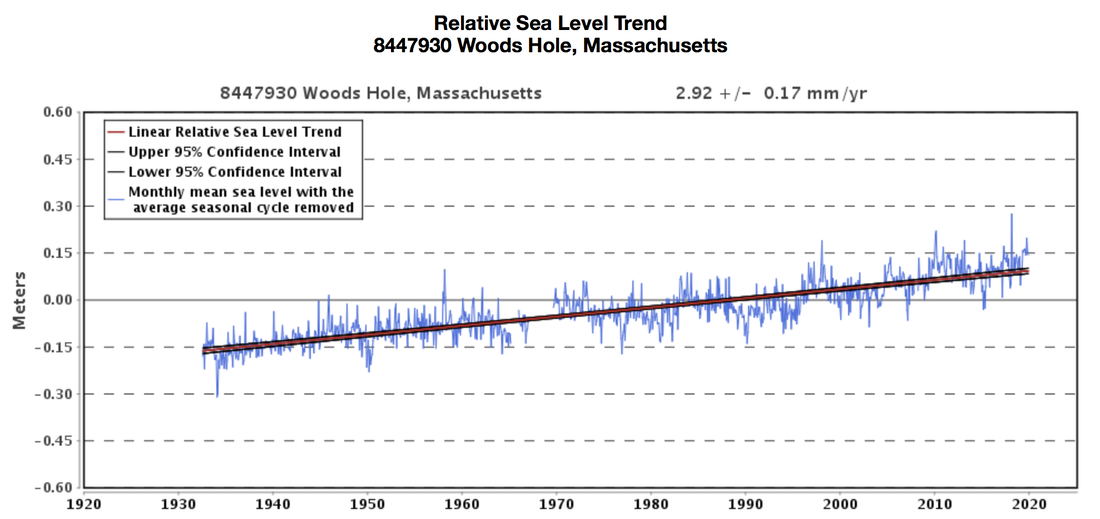
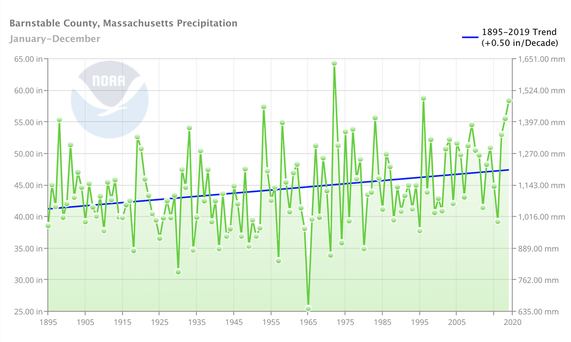
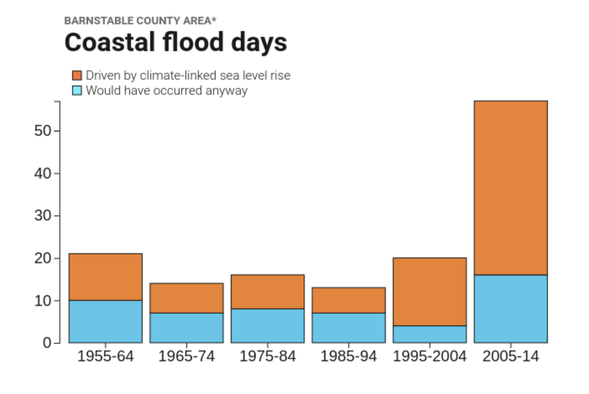
Article Editor: Maddie Bowen, Georgetown University Climate change and the local environment:As atmospheric temperatures around the world soar, oceanic water temperatures are increasing too, and glaciers and ice sheets are melting. Because water molecules in warmer water exhibit greater molecular movement, water expands in volume as it heats up. Furthermore, melting polar ice adds to the amount of water not in ice sheets, again causing a rise in sea levels globally. Nonetheless, it is important to recognize that regional variations in atmospheric and oceanic circulation patterns, in addition to other factors, also influence the extent of sea level rise. As global sea levels continue to rise, exposed coastal communities must be prepared for an increased risk of flooding. Barnstable County, located on Cape Cod in Massachusetts, has already experienced a sea level increase of 11 inches since 1922, almost 2.85mm annually. Its vulnerable coastal position, located on 550 miles (890 km) of shoreline, contributes to the risk of flooding in the County in the face of sea level rise. Barnstable County has also seen an upward trend in annual precipitation levels. As the atmosphere warms, the rate of evaporation increases. Quicker rates of evaporation pulls more water into the atmosphere which is then accessible for precipitation. Thus, the overall trend of atmospheric warming contributes to the rise in both frequency and intensity of precipitation events. Despite the annual variation in precipitation levels, the general progression seen over the past century in the graph above shows increasingly wetter conditions for Barnstable County. Hurricanes are also becoming more powerful as a consequence of warming global temperatures. Because hurricanes form over warm ocean waters, the increase in oceanic temperatures fuel hurricanes with more energy to activate higher peak winds and greater rainfall. Sea level rise also worsens the damages of hurricanes, as higher coastal inundation levels can increase the risk of storm-surge flooding. Although climate change does not necessarily impact the frequencies of hurricanes, it increases the severity of storms that have the potential to reach the coast of Cape Cod and cause tremendous damage. The increased levels of precipitation, rising sea levels, and more powerful hurricanes have elevated the number of coastal flooding days in Barnstable County. These factors have not only made floods become more frequent, but have also made them more severe. The graph above shows the growing number of coastal flood days that can be linked to climate-driven sea level rise. The County has already experienced severe coastal flooding, and likely will suffer in the future as temperatures and sea levels continue to rise. How we know:This information relies on data from easily accessible online tools including the National Oceanic and Atmospheric Administration (NOAA) Tides and Currents tool, the NOAA Climate at a Glance resource, and Climate Central’s Surging Seas: Risk Finder projections. It also draws on conclusions from a NOAA study connecting hurricane severity to global warming. The NOAA Tides and Currents resource collects data from over 100 water level stations in order to reconstruct sea level trends at the local level. The NOAA Climate at a Glance tool generates graphs using data gathered from weather stations to show trends in temperature, precipitation, and drought on global, regional, and local scales. Climate Central’s Surging Seas projections display sea level rise and flood risks for coastal locations. Human consequences:Barnstable County acts as one of the biggest barrier islands in the world, shielding Massachusetts from the full weight of storms. Because of its location, the County’s shoreline is vulnerable to coastal flooding in the face of hurricanes. Even during small rain events, the Barnstable County drainage system is overwhelmed, resulting in the flooding of state roadways and personal properties. The heavy rainfall associated with severe hurricanes has caused especially severe flooding and significant property damage. Hurricanes throughout the 20th century have been tremendously destructive in Barnstable. The Great New England Hurricane of 1938 struck the Cape at a high tide, causing a storm surge of up to 15 feet. The devastating effects of the storm were felt throughout Barnstable County’s southern coast and into many of the inlets and bays. Parts of the County were flooded with up to 8 feet of water and struck with winds that reached over 120 mph, causing damage to houses, trees, and crops. With rainfall totaling over 17 inches, thousands of homes, businesses, and fishing fleets were destroyed or damaged from severe flooding. Barnstable County was again hit with a devastating hurricane in August of 1991, with Hurricane Bob damaging Buzzards Bay most significantly. Most of the County was under 5 to 10 feet of water, with wind gusts reaching over 120 mph. Many Massachusetts residents were left without power, and beaches suffered greatly from eroding coastlines. This hurricane forced a full evacuation in the height of the tourist season, shutting down the Cape for the rest of the summer and threatening the economic livelihood of many occupants. Hurricane Bob proved to be costly, with over $69 million in damages to public property, as well as $10 million of agricultural damages to local peach and apple orchards. The intensity of hurricanes and the risk of coastal flooding in Cape Cod has only increased throughout the past century. As temperatures warm and sea levels rise, these can only be expected to become more common and devastating in the future. While low cost flood insurance has been provided to the community, Barnstable County must decipher the best way to build up resilience in the face of the rising threat of climate change in order to keep its beloved coastal communities intact. Further reading:Barnstable County Multi-Hazard Mitigation Plan. Cape Cod Commission Massachusetts Hurricanes of the 20th Century. Massachusetts Office of Coastal Zone Management Cape Cod Climate Change. The Boston Globe Article Author: Maya Gibbs, Georgetown University
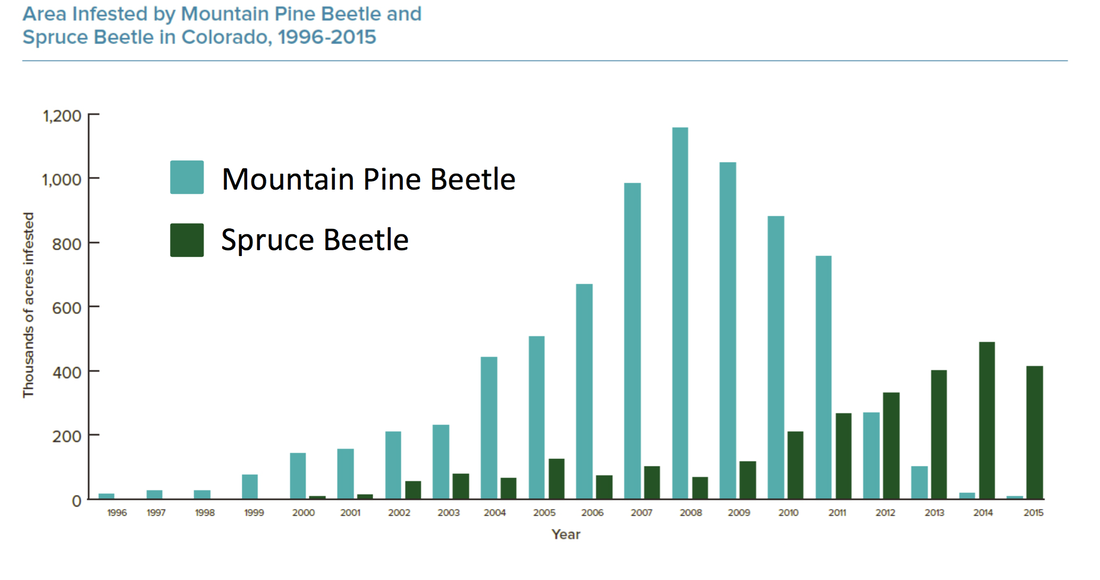
Article Editor: Maddie Bowen, Georgetown University Climate changes and the local environment:Average annual temperatures in heavily-forested Larimer County have steadily increased since the 1970s. Since the rate at which water evaporates rises as temperatures warm, drought has grown more common in the county. Drought places pine trees in the county under stress, leaving them vulnerable to infestation by mountain pine beetles. Cold winter temperatures can kill these beetles and their larvae, especially if temperatures fall quickly in autumn. Yet rising winter temperatures have permitted huge numbers of beetles to survive into each spring. Meanwhile, by suppressing forest fires, foresters in Larimer County have made forests unnaturally dense with mature trees. Since mountain pine beetles prefer big trees with thick bark, these older trees are especially vulnerable to infestation. 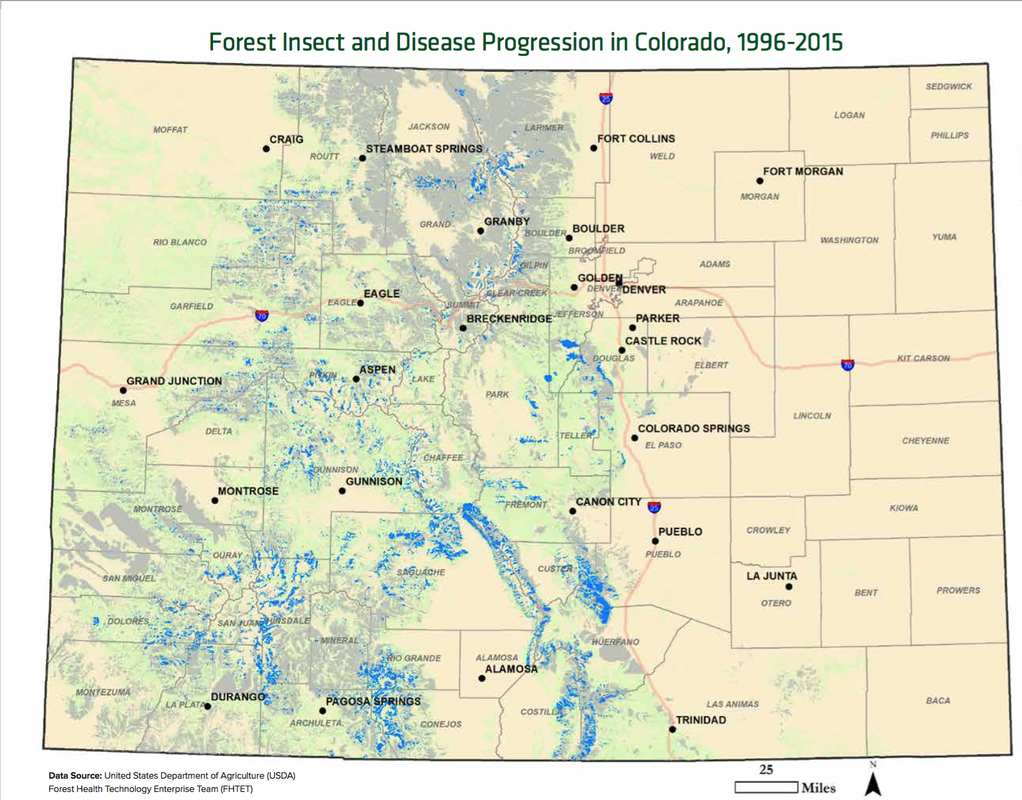 Map showing the amount of forests in Colorado that have been affected by diseases or insects from 1996-2015. The grey shading indicates forests that were affected from 1996-2014, and the blue color indicates forests that were newly affected in 2015. This map was produced from aerial data and provided by the United States Department of Agriculture. Source: Colorado State Forest Service. An attack begins with a single female beetle. The beetle burrows into the bark of a pine tree and releases a pheromone signal. The signal summons more beetles, which gather and attack the tree. Once the tree has been compromised, meaning that the flow of nutrients through the trunk has been impeded, the beetles deposit their larvae and continue onward, attacking nearby mature trees. While trees have numerous natural defenses to these beetles, the stress imposed on them by warming temperatures compromises their ability to use those defenses. To make matters worse, the mountain pine beetle has evolved to be able to ingest toxic resin that acts as one of the tree’s natural defenses. There is a cyclical character to mountain pine beetle infestations. As mature trees die and their population declines, so do numbers of mountain pine beetles. Yet rising temperatures and increasing drought have nevertheless expanded the beetle's range and overall population size. Since dead trees release carbon dioxide as they decay, mountain pine beetles are turning the forests of Larimer County and the western United States into a source of greenhouse gases that contribute to global warming. They are therefore worsening the climatic trends that have contributed to their booming numbers. How we know:This information is based on reliable, easy to use tools provided by the National Oceanic and Atmospheric Administration (NOAA) State Annual and Seasonal Time Series and the NOAA Climate at a Glance app. Both tools use data collected at weather stations and stored in NOAA's U.S. Climate Divisions database. This article also draws on data from a 2015 aerial survey administered by the Colorado State Forest Service. Human consequences:Colorado forests purify the air and water; generate reliable sources of wood products; and provide opportunities for lucrative outdoor recreation activities. Some 90% of Colorado's inhabitants engage in outdoor recreation per year, and everyone benefits from the crucial economic and environmental resources generated by the state's forests. As of 2017, the state has a $17.3 billion tourism industry that relies on the aesthetic beauty of forested landscapes to attract visitors. Colorado is therefore a state that depends on the health of its forests. Thus, a threat to Colorado’s environment is a threat to its social and economic wellbeing. Perhaps the most profound consequence of the mountain pine beetle epidemic for the people of Larimer Country involves the relationship between warming, beetle infestations, and wildfires. Dry, dying trees are much more vulnerable to wildfires, and length of the annual wildfire season in Colorado has therefore increased by more than two months since 1970. In their immediate vicinity, wildfires threaten human property, livelihoods, and safety. Even at range, wildfire smoke can threaten human health, as inhalation can compromise respiratory function. Wildfires and declining overall forest health also reduce the quality of available water in Larimer County, and across Colorado. Forests naturally filter precipitation, maintaining clear waterways, but wildfires threaten water quality by introducing toxins into streams and watersheds. Since decaying trees release nitrates, mountain pine beetle infestations also increase the concentration of dangerous nitrates in the water supply. Larimer County officials are therefore carefully monitoring water quality in their county. Their efforts - and those of officials across Colorado - have broad significance. Nineteen states obtain their water supply from river systems originating in Colorado. Warming will impact not only the supply, but also the safety, of the water they acquire. Further reading:Pine Beetle Epidemic. National Geographic 2015 Report on the Health of Colorado’s Forests. Colorado State Forest Service 2012 Report on the Health of Colorado’s Forests. Colorado State Forest Service Climate Change and Ecosystem Disruption. Am J Public Health Mountain Pine Beetle & Cold Temperatures. Government of Alberta Clean Air, Water and Soil. Larimer County Website Article author: Esther Doerr, Georgetown University
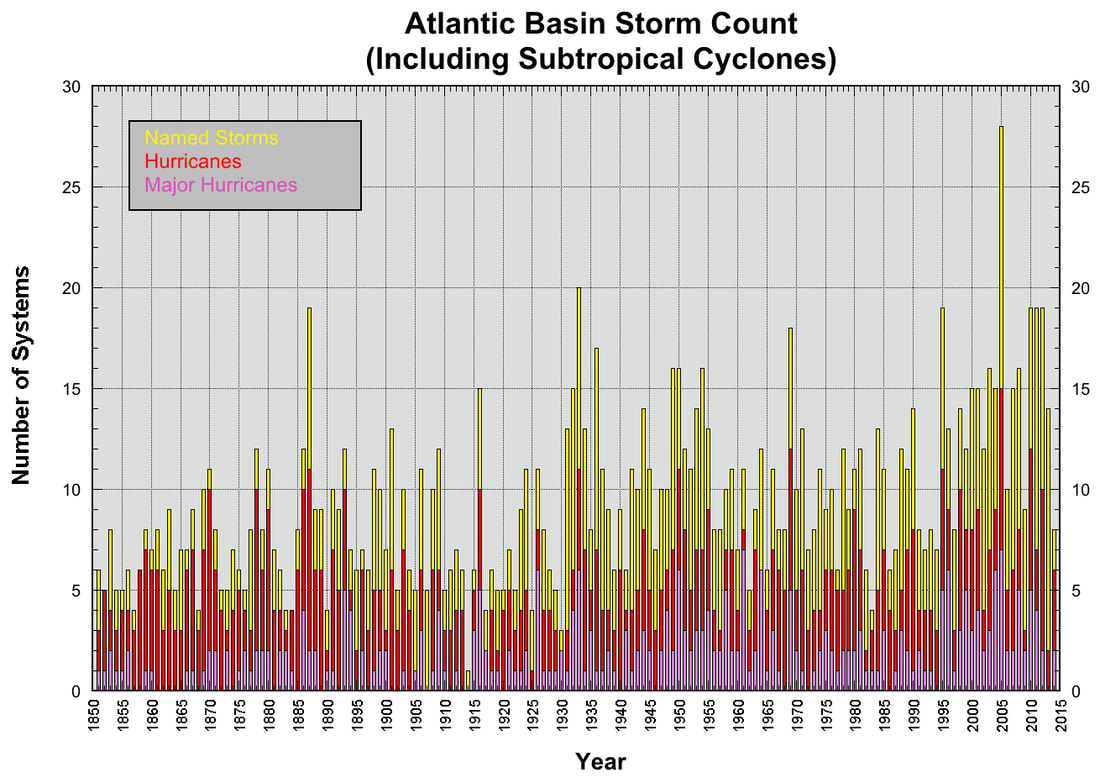
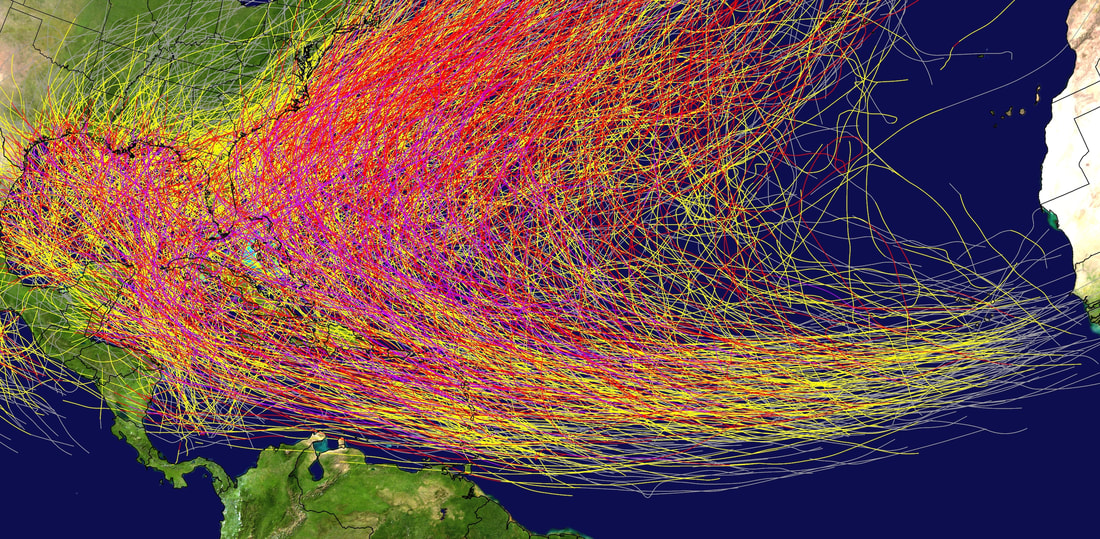
Article editors: Dr. Dagomar Degroot, Georgetown University; Sarah Harper, Georgetown University Climate changes and the local environment:Haiti is a country prone to extreme weather: floods, droughts, and especially hurricanes. Typically, hurricanes make landfall on the southern coast of Haiti, and as a result communities located there experience the greatest storm surges. The largest city on a south-facing coastline is the commune of Gonaïves. The frequency of Atlantic hurricanes has increased sharply since the 1980s, and seems to have risen overall since the 19th century. However, it is hard to determine exactly how many hurricanes churned through the Atlantic before the widespread use of weather satellites. Our understanding of long-term trends in hurricane frequency may therefore be skewed by early underreporting of remote or short-lived hurricanes. Still, it seems clear that major hurricanes in particular have grown more common as sea surface temperatures warm across the Atlantic, and particularly in the Caribbean Sea. Hurricanes are fueled by warm, moist air rising from warm water. The warmer the water, the more fuel hurricanes can use. The most powerful hurricanes, with sustained winds at or above 130 mph (209 km/h), have rarely made landfall in Haiti. Category 5 hurricane Irma, for example, only lightly grazed northern Haiti. Yet substantial hurricanes have recently made made landfall in Haiti and caused catastrophic flooding in Gonaïves. Moreover, hurricane storm surges are higher now than they once were, owing in part to a modest but sustained increase sea levels on the Haitian coast. Hurricane floods have also been slow to recede from Gonaïves, owing to surrounding mountains that trap water within the commune. Long-lasting floods have raised the salinity of soil and groundwater around Gonaïves, and have thereby repeatedly hindered rice cultivation. Meanwhile, deforestation on and around the mountains near Gonaïves has led to mudslides amid torrential rainfall during and after hurricanes. How we know:This summary makes use of reconstructions compiled by the National Oceanic and Atmospheric Administration (NOAA) National Hurricane Center, which provides easy to use visualizations that record the history of hurricanes in the Atlantic Basin. It also draws on an overview of changes in hurricane frequency provided within the U.S. National Climate Assessment, and a skeptical assessment of hurricane trends published by the NOAA Geophysical Fluid Dynamics Laboratory. Human consequences:Haiti today is almost entirely deforested, and that has greatly increased the vulnerability of its coastal cities to hurricanes. Beginning in the seventeenth century, European settlers imported slaves from Africa to work in plantations that destroyed much of the indigenous forest of the island of Hispaniola, which includes Haiti. Late in the twentieth century, impoverished Haitians destroyed almost all the forests that remained in order to exploit charcoal. With oil and coal too expensive for most Haitians to afford, charcoal provided one of the few accessible sources of fuel. Exposed hillsides now offer no resistance to floodwaters, and easily crumble in devastating mudslides. Meanwhile, nearly all of Haiti's watersheds are deforested. In this context, active hurricane seasons can provoke human suffering on a vast scale across Haiti, and those seasons have grown more common. In 2004, for example, Hurricane Jeane dropped 13 inches of rain on the northern mountains of Haiti and caused catastrophic flooding in and around Gonaïves. Nearly 3,000 Haitians lost their lives. In 2008, no fewer than four hurricanes made landfall in Haiti. Floods were particularly devastating in Gonaïves, but overall houses belonging to nearly 800,000 Haitians were either damaged or destroyed. Floods swept away roughly 70% of Haiti's crops and thereby provoked widespread hunger and malnutrition. Festering flood waters provided ideal conditions for the spread of cholera, malaria, and West Nile disease. In 2016, Hurricane Matthew, a major category 4 storm, devastated southern Haiti and killed over 900 people. Haitians have not remained passive in the face of these challenges. Recently, the Haitian government has partnered with international aid groups and celebrities to launch a major reforestation program. International efforts, meanwhile, aim at reducing social and gender inequality across Haiti, and thereby fostering resilience to climate change in communities such as Gonaïves. Article author: Armelle Déjoie, Georgetown University
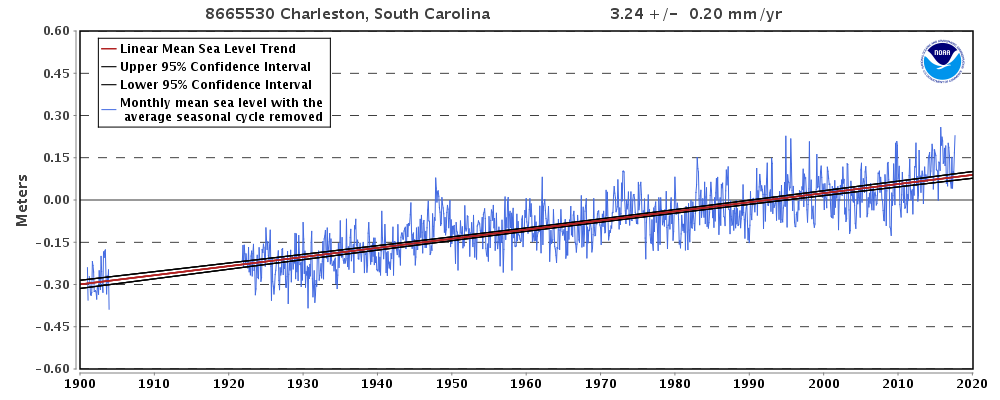
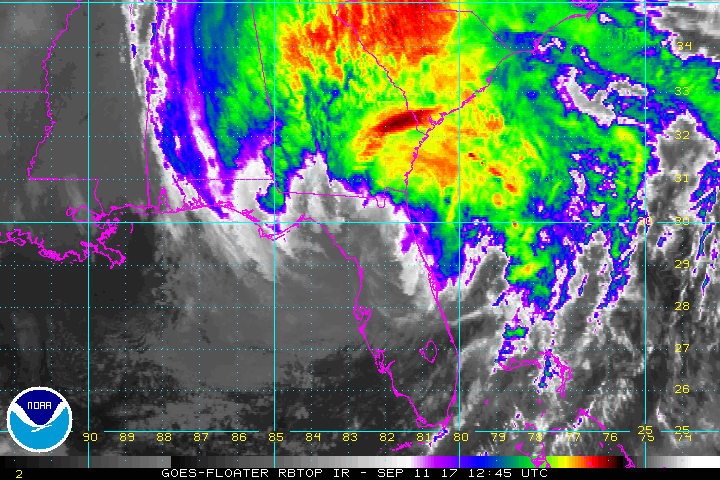
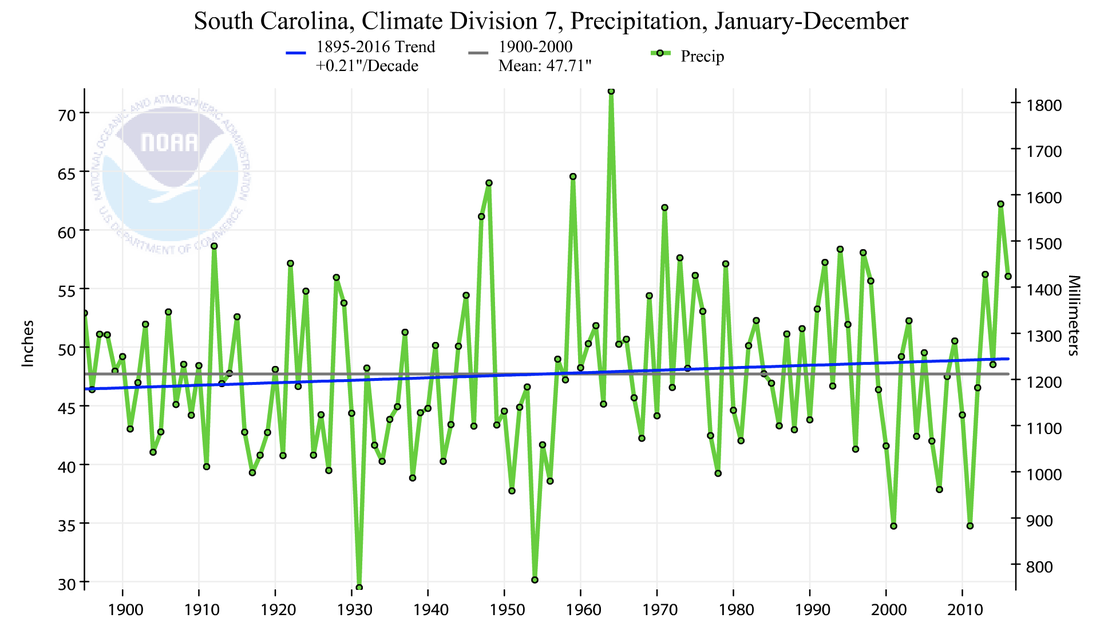
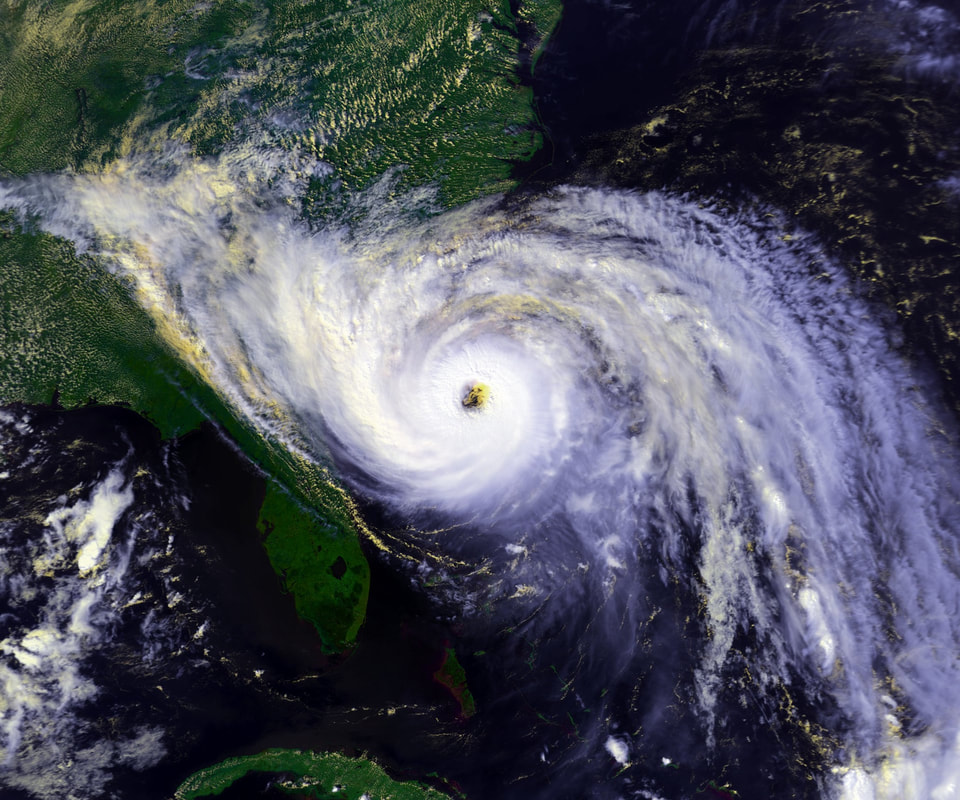
Article editor: Dr. Dagomar Degroot, Georgetown University Climate changes and the local environment:Mean global sea levels have risen by at least 17 cm (nearly 7 inches) in the twentieth century. Yet regional variations in ocean temperatures, prevailing winds, ocean currents, and the rise or fall of Earth's crust mean some areas have experienced, and will experience, greater sea level increases than others. Over the past century, sea levels of Charleston, South Carolina have risen by nearly one foot (30 cm, or 12 inches), and have increased by an average of 3.2 mm per year. In recent decades, rising sea levels have sharply increased the risk of flooding in Charleston during periods of heavy rain. Average annual precipitation has increased only modestly in Charleston, but rainstorms have grown significantly more common. As sea levels climbed, floodplains have also increased in size, meaning that more people and property each year became vulnerable to flooding. Nuisance flooding, or flooding from high tides without a storm, is four times more common in Charleston today than it was in 1950. Meanwhile, hurricanes and tropical storms have grown more powerful and more capable of causing catastrophic flooding when they make landfall. From 1975-1989, roughly 20% of hurricane strengthened to category 4 or 5, with winds at or above 130 mph (209 km/h). From 1990-2004, the share that reached at least category 4 had increased to 25%. Hurricanes are fueled by warm, moist air rising from warm water. The warmer the water, the more fuel hurricanes can use. In recent years, sea surface temperatures have provided ample fuel for hurricanes that ultimately made landfall in South Carolina. Hurricane Matthew made landfall in 2016, and hurricane Irma reached Charleston as a tropical storm in 2017. Though much weakened from the historic intensity it reached in Caribbean, Irma brought a high tide of nearly 10 feet to Charleston, which sent flood waters cascading into the city. How we know:This information draws on a National Oceanic and Atmospheric Administration (NOAA) study that connects global warming and hurricanes, and a widely-cited 2006 study in the journal Science that reconstructs changes in the frequency of the most powerful tropical cyclones. It also makes use of reliable, easy to use tools that are freely available online: the the NOAA Climate at a Glance app, and the NOAA Tides and Currents resource. The Climate at a Glance tool uses data collected at weather stations and stored in NOAA's U.S. Climate Divisions database. The Tides and Currents tool reconstructs sea level trends using measurements from U.S. and Global Stations, screening out regular seasonal fluctuations due to coastal ocean temperatures, salinities, winds, atmospheric pressures, and ocean currents. Human consequences:Tropical storms and hurricanes have crippled coastal cities like Charleston. In 1989, for example, hurricane Hugo swept ashore in South Carolina as a category 4 storm. It was fast-moving, and it therefore dropped only a relatively modest amount of rain. Yet its power resulted in a storm surge that reached 20 feet in some stretches of the South Carolina coast. Sustained winds in downtown Charleston reached 87 mph (140 km/h), but gusts exceeded 108 mph (174 km/h). The wind and water destroyed rows of beach houses, shattered docked boats, and collapsed part of the Ben Sawyer Bridge. The storm caused nearly $12 billion (2017 USD) in damage and directly or indirectly resulted in 35 deaths across South Carolina. In 2017, Irma sent roughly 4 feet of ocean water spilling into downtown Charleston and caused the worst flooding in the city since Hugo made landfall. Since residents had not been ordered to evacuate, many were caught off guard by the flooding, and some needed rescuing. Irma was the costliest storm to reach Charleston since Hugo, and caused well over $1 billion in damage across South Carolina. Less damaging but far more common nuisance floods have also imposed high costs on coastal communities across South Carolina, including Charleston. Tidal floods have inundated and therefore closed roads, and even modest floods have damaged vehicles exposed to the salty water. Heavy rain, meanwhile, has repeatedly caused flooding that drainage systems can only gradually alleviate. Since 1990, taxpayers in Charleston have spent over $238 million to repair drainage systems damaged by tidewater. The worst flooding in Charleston has occurred in former marshes that once provided protection from rising waters but have now been filled in for development. Particularly at risk areas are actually sinking relative to the sea, since many were built on soil deposited by bulldozers that has grown more compact with time. Efforts have been made to stabilize beach houses and "renourish" beaches, which involves expanding beaches with sand from other sources. These ongoing initiatives have fortified at least some of the South Carolina coast in the face of rising seas. Further reading:The Front Lines of Climate Change: Charleston’s Struggle. Climate Central Your Post-Storm Update: Charleston Assesses Irma's Damage. The Post and Courier Article author: Kevin Berning, Georgetown University
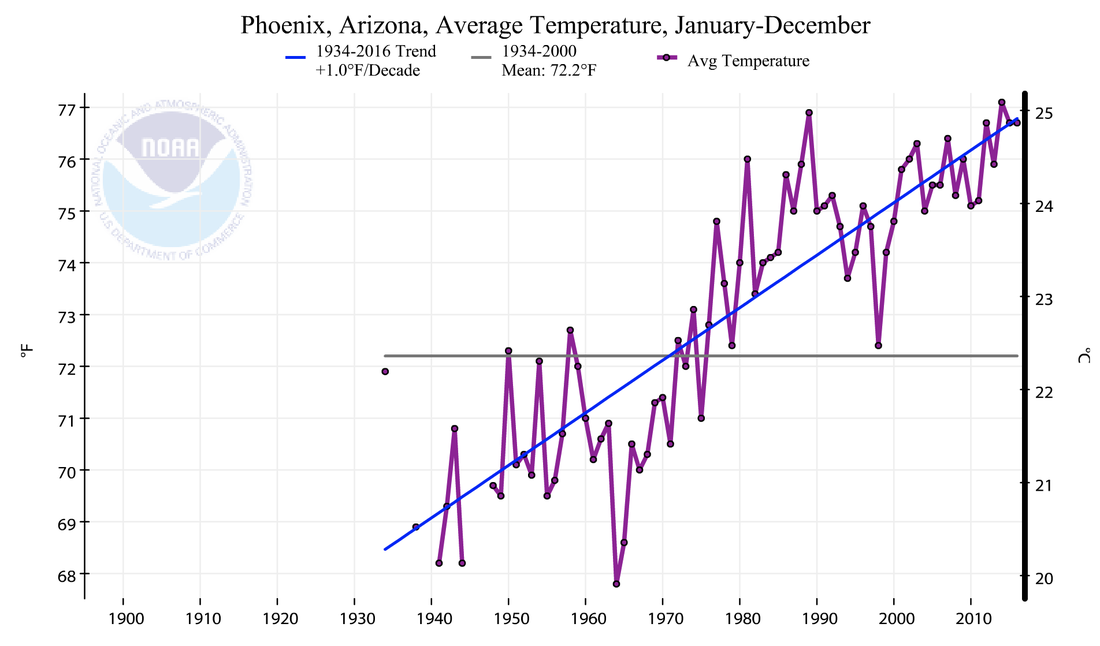
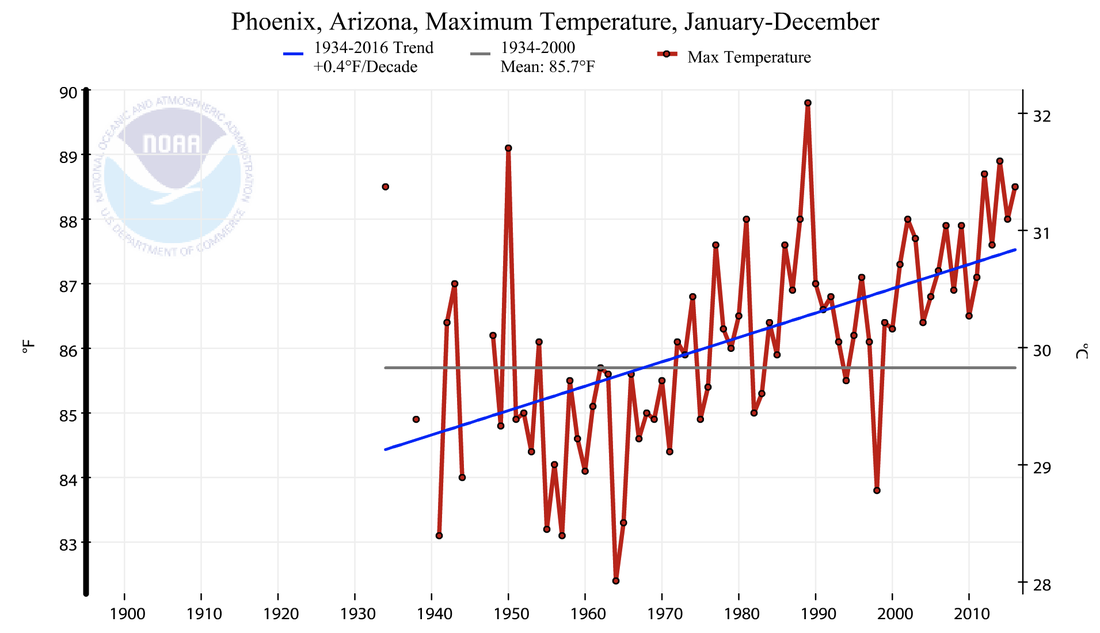
Article editor: Dr. Dagomar Degroot, Georgetown University Climate changes and the local environment:Since 1970, average annual temperatures in Arizona have soared. In densely-populated Maricopa County, which includes Phoenix, average annual temperatures have risen by over 7° F (nearly 4° C), which is roughly four times the global average. In no major U.S. city have temperatures climbed more quickly. This remarkable rise has sharply increased the frequency of particularly extreme weather. In the summer of 2017, for example, a heat wave sent temperatures soaring to over 120° F (nearly 50° C). Summer days with relatively cool temperatures, by contrast, have grown scarce. From June to September 2017, only 14 days had high temperatures lower than 100° F. Higher temperatures have increased rates of evaporation across Arizona, and therefore dried much of the state. Average annual precipitation in Maricopa County has actually increased slightly over the past century, yet precipitation in mid to late summer has declined substantially. Summer droughts have therefore become common in Maricopa County. Warming, drying trends have created ideal conditions for wildfires across Arizona, including in Maricopa County. Wildfires in Arizona have therefore grown more frequent, and they last longer. In spring 2017, a wildfire in Maricopa County’s Tonto National Forest consumed some 500 acres of woodland. How we know:These reconstructions are largely based on reliable, easy to use tools that are freely accessible online: the National Oceanic and Atmospheric Administration (NOAA) State Annual and Seasonal Time Series, the NOAA Climate at a Glance app, the National Drought Mitigation Center's United States Drought Monitor. NOAA's State Annual and Seasonal Time Series and Climate at a Glance tools use data collected at weather stations and stored in NOAA's U.S. Climate Divisions database. The Drought Monitor compiles weekly maps of drought conditions across the United States, and combines climate, soil, and water data with reports from 350 experts across the country. Human consequences:Rising summer temperatures in Arizona have increased the number of heat-related deaths in Maricopa County. Especially hot, dry weather can provoke dehydration and heat stroke, and can interfere with cardiovascular, respiratory, and nervous systems. The very old, the very young, and the sick are especially vulnerable, particularly in poor neighborhoods where some households might not have dependable access to air conditioning. Employees who spend most of their time outside - such as construction workers - are also at risk. Heat-related threats to human health can be especially great in cities like Phoenix, where paved surfaces create urban heat sinks that amplify hot temperatures. In 2016, Maricopa County endured 130 heat-related deaths, the most in the last 15 years. On average, Arizona hospitals now treat almost 2,000 patients per year for heat-related illnesses. Many injuries and deaths not only reflect warming trends, but also social and infrastructural problems that make it hard for people to escape the heat. Wildfires in Arizona, including in Maricopa County, have also proven costly for state and federal governments. Containing the Arizona wildfires has cost many millions of dollars, and the total costs of wildfires can exceed suppression costs by more than 30 times. In Maricopa County, smoke billowing from fires in Tonto National Forest, for example, shut down Bush Highway. Foresters have conducted controlled burns to limit the future risk of major wildfires in the forest, but prolonged drought has foiled some of these efforts. In Phoenix, the municipal government has taken steps to lower the city's contribution to climate change. It has expanded public transit, constructed new bike lanes, purchased electric vehicles, installed low-energy bulbs in street lighting, and set ambitious goals for cutting greenhouse gas emissions. Still, adapting to climate change has proven to be an even more daunting task, especially for the city's less affluent residents. Further reading:A Building Boom and Climate Change Create an Even Hotter, Drier Phoenix. LA Times Phoenix Will Be Almost Unlivable by 2050 Thanks to Climate Change. Vice Article author: Luke Powers, Georgetown University
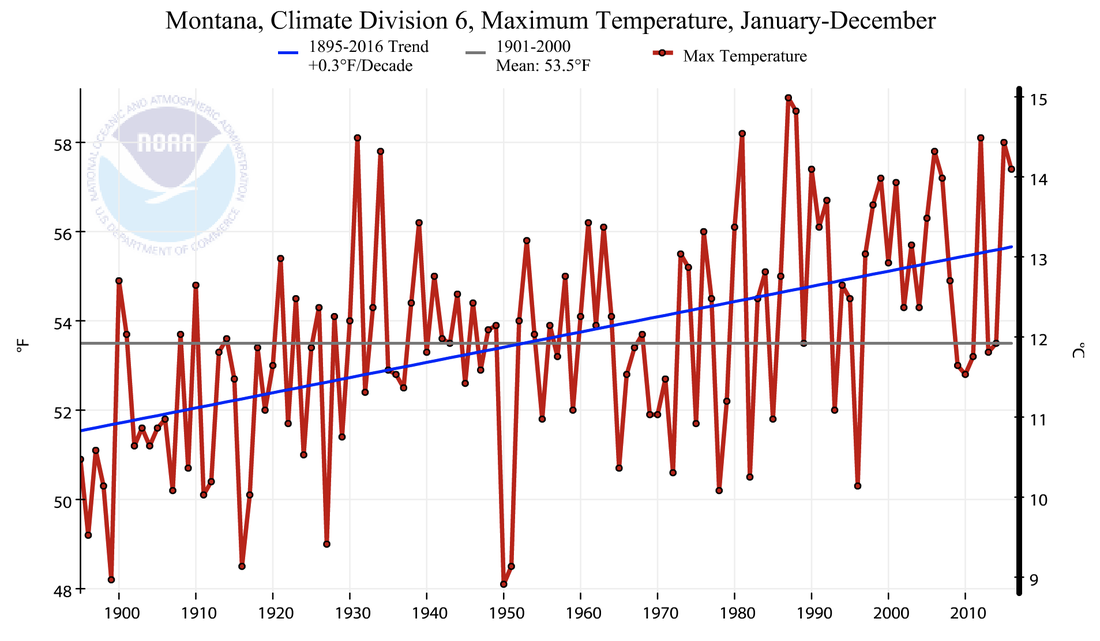
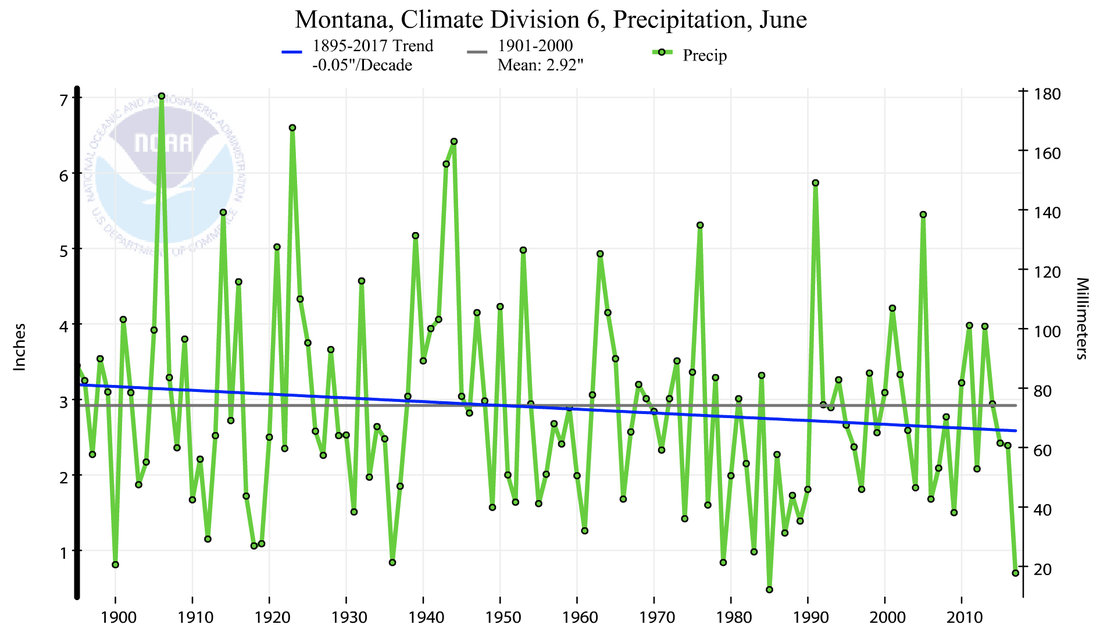
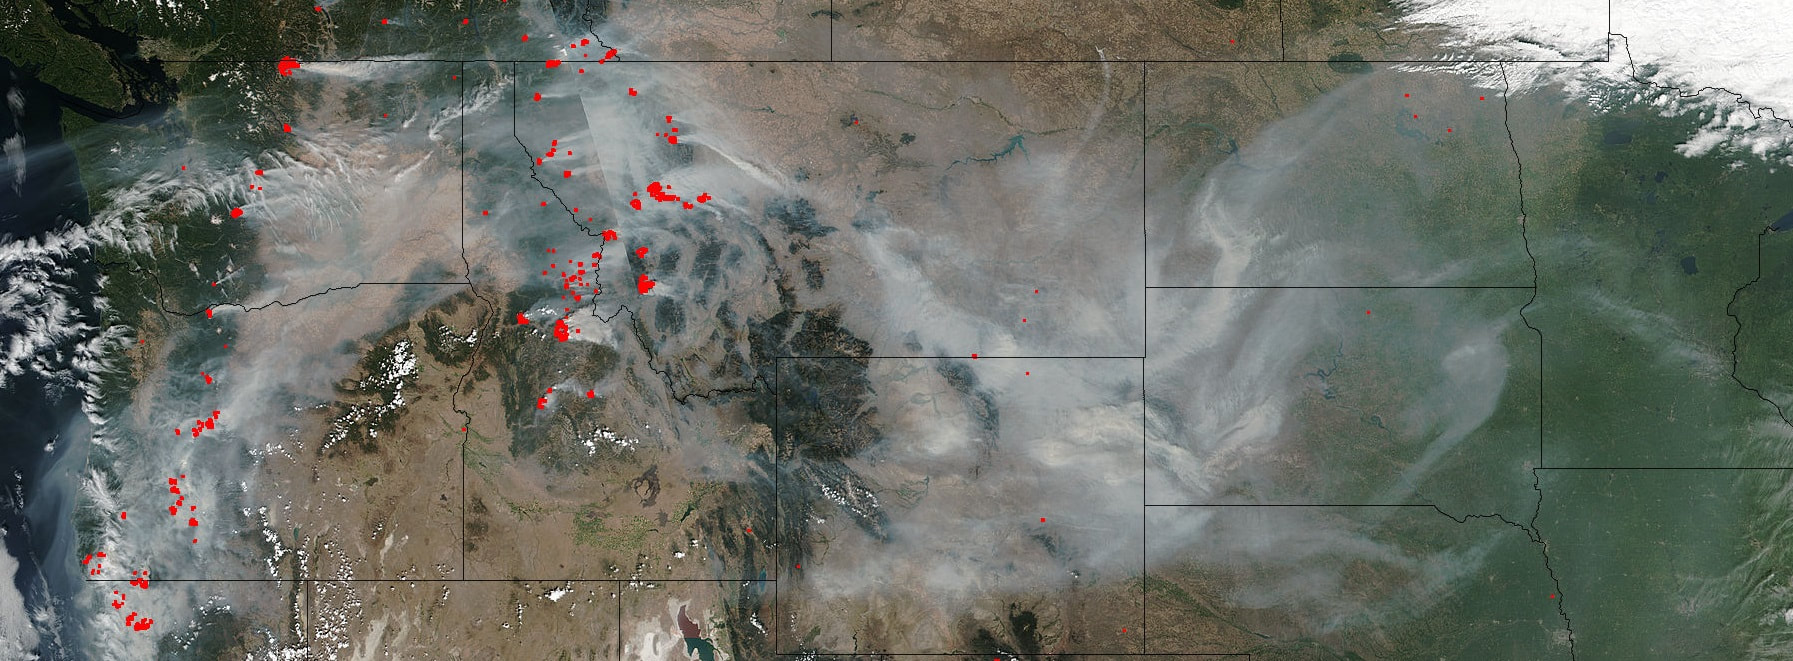
Article editor: Dr. Dagomar Degroot, Georgetown University Climate changes and the local environment:Over the past century, average annual temperatures have soared across Montana, rising by almost 2° C (3° F) relative to twentieth-century averages. Warming has shortened winters, and earlier thawing has prevented snow from accumulating. Hotter spring, summer, and fall temperatures have also increased the rate of evaporation across Montana. Average annual precipitation in Montana has increased modestly. However, rainfall has only increased in the early spring and late fall, and precipitation in the summer has actually become more scarce. The summer dry season is therefore drier and longer than it once was. Extreme droughts are now much more likely to occur than they once were. Together, these changes have created ideal conditions for wildfires in heavily forested but sparsely populated Garfield County, Montana. In the summer of 2017, no fewer than 21 wildfires broke out in Montana during a particularly severe, long-lasting drought. Together, the wildfires consumed nearly 1.3 million acres of forest, and two fires alone each burned across over 100,000 acres. National data suggests that climate change, not shifting forest management practices, were responsible for the 2017 wildfires in Garfield county. Beginning in the 1980s, large wildfires across the United States suddenly grew more common, and lasted longer, especially in regions lightly touched by forest management practices. Almost everywhere, rising spring and summer temperatures, and an earlier spring snowmelt, were largely to blame. By burning through old trees and brush, wildfires can bring new life to a forest, making way for diverse plant species and creating new habitats for animals. Yet the dramatic increase in the frequency, scale, and length of wildfires in Montana has interfered with the ability of forests to recover. How we know:These reconstructions are largely based on reliable, easy to use tools that are freely accessible online: the National Oceanic and Atmospheric Administration (NOAA) State Annual and Seasonal Time Series, the NOAA Climate at a Glance app, the National Drought Mitigation Center's United States Drought Monitor. NOAA's State Annual and Seasonal Time Series and Climate at a Glance tools use data collected at weather stations and stored in NOAA's U.S. Climate Divisions database. The Drought Monitor compiles weekly maps of drought conditions across the United States, and combines climate, soil, and water data with reports from 350 experts across the country. These reconstructions also draw on visualizations provided by the National Interagency Fire Center, which has created a tool that predicts the potential of new wildfires based on previous weather conditions. They also rely on an important 2006 study in the journal Science, which finds clear links between warming and wildfires. Human consequences:In recent decades, the environment of Garfield County has grown more dangerous for its human residents. In 2017, the Lodgepole wildfire spread into Garfield County and eventually consumed an area the size of New York City. After billions of dollars were spent to control the fire, and two firefighters lost their lives, the county nevertheless lost over 20 buildings. Meanwhile, drought and wildfires have together undermined cattle ranching, a staple of Montana's economy and culture. Fires not only destroyed grazing land and killed cattle, but also incinerated nearly 2,300 km (1,300 miles) of fencing, and required costly hay imports. Some ranchers have had to sell cattle in huge quantities because there is no more grazing land to support them, and many ranchers will lose "genetics" that have taken years to hone. Young ranchers have seen their businesses ruined before they ever got off the ground. The destructiveness of the 2017 wildfires have provoked renewed debate about logging in the forests of Montana. Advocates insist that logging reduces the risk of forest fires and spurs Montana's economy. Skeptics point out that although millions of acres of forest have been cleared of dangerous fire "fuels" - including in Garfield County - wildfires nevertheless burned uncontrollably. Droughts worsened by climate change have overwhelmed local attempts to confront wild fires. Further reading:Long-term Losses of Montana's Fire Season Amount to Much More than Scorched Grass. Billings Gazette Montana Wildfires Reignite Logging Debate. NPR Wildfire Myths: Logging the Forest Won’t Save It. Counter Punch Garfield County Community Wildfire Protection Plan. Walsh Environmental Scientists and Engineers, LLC Article author: Sabine Neschke, Georgetown University
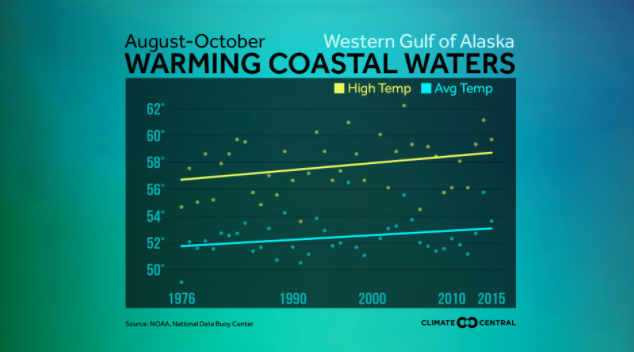
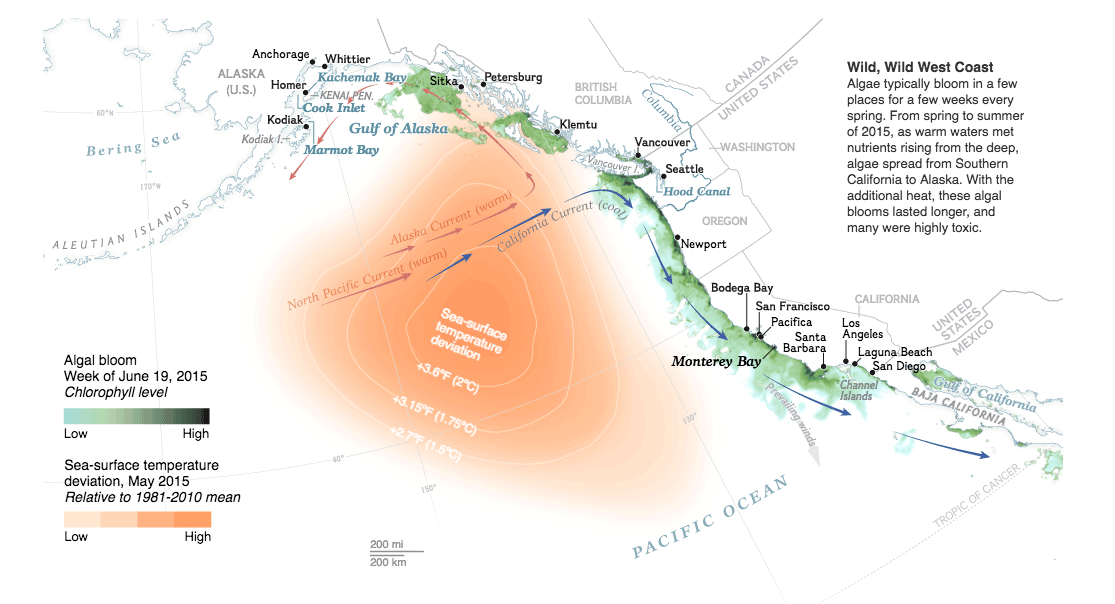
Article editor: Dr. Dagomar Degroot, Georgetown University Climate changes and the local environment:Between 2013 till early 2017, the east pacific along the west coast of the United States experienced incredibly high temperatures. In 2013, a patch of alarmingly warm water developed along the Gulf of Alaska, due to a force called “The Blob.” The Blob was a patch of warm air that built up when decreased winds failed to distribute and cool the sea surface. In January of 2014, a natural cycle called the Pacific Decadal Oscillation (PDO) shifted to a warm phase and began adding to the pre-existing heating from the Blob. The PDO naturally alternates between periods of warming and periods of cooling along the Gulf of Alaska, and in 2014 it began a warming trend that continued into 2016. However, while the PDO is a natural cycle, it is likely that it has been increasingly impacted by human caused climate changes in the last 30 years. Human actions, such as greenhouse gas emissions, have led to increases in temperature, which intensify the natural warming of the PDO. While they have already begun to have an impact on Sitka and the Gulf of Alaska, these human effects will only continue to magnify the PDO’s effect further in the next few decades, as sea surface temperatures continue to increase. Because of the high temperatures in the Gulf of Alaska, a toxic algae bloom formed along the coast of Sitka and lasted longer than normal. Algae flourishes in hot areas, so the unusually warm trend was perfect for growth. How we know:The warming trends seen in the Gulf of Alaska between 2013 and 2016 can be accessed online through various sources, such as the National Oceanic and Atmospheric Administration (NOAA) Northwest Fisheries Science Center and the NOAA National Data Buoy Center. NOAA’s buoy data has been organized in this article to show the rising temperatures along the United State’s coastal waters. NOAA’s data on sea surface temperature is gathered from satellites observations and from drifting buoys stationed along coasts that collect temperatures at different depths. Data on algal blooms is collected by sampling water along the coast and counting the algae present in the sample. This article from National Geographic shows the trend between the increased temperatures starting in 2013 and algal blooms. Large scale changes in climate such as the PDO can be modeled by combining measurements of sea ice, taken by satellite measurements, with sea surface temperatures overtime. This study from the journal Climate Dynamics uses these two measurements to discuss the likely connection between human caused warming and magnified PDO cycles. Human consequences:The increase in temperature along the coast of Sitka killed zooplankton on a large scale. With zooplankton populations low, animals that rely on plankton for food and others further up the food chain, like starfish, sea birds, whales, and sea otters, experienced large die offs. These trends also impacted the Coho salmon populations, leading to a harvest in 2016 that was below the 10 year average. Impacts of the warming trend in 2015 and 2016 will not be observed for the Chinook salmon until later in 2017, but they are predicted to have a similarly negative impact. In an economy where 1 in 10 jobs are supported by salmon, decreases in Salmon production have major impacts on the community. The large-scale algal bloom also put Sitka’s subsistence harvesters at risk. The toxic algae collect in the body of shellfish as water filters through them. When people harvest and eat infected shellfish, the toxins from the algae can cause symptoms as severe as brain damage or death. The first death in Sitka recorded as a result of poisoned shellfish appeared in 1799 and more have continued to pop up throughout the years. Large-scale algal blooms, like the one in 2015, spread the toxins and put the harvesters of Sitka at risk. Shellfish that is collected on the Sitka shore provide a cheap source of protein that is becoming increasingly vulnerable. While the effects of the Blob and PDO began receding in 2017, they foreshadowed how the ocean will look in a warming world. For the people of Sitka in particular, a warmer ocean could undermine local food sources and employment. Further reading:Paralytic Shellfish Poisoning (PSP) Warning Issued for Southeast Alaska. Sitka Local Foods Network Harmful Algal Blooms—Exacerbated by Warming Ocean Temperatures. U.S. Climate Resilience Toolkit Run Forecasts and Harvest Projections for 2017 Alaska Salmon Fisheries and Review of the 2016 Season. Alaska Department of Fish and Game Article author: Eve Kelly, Georgetown University
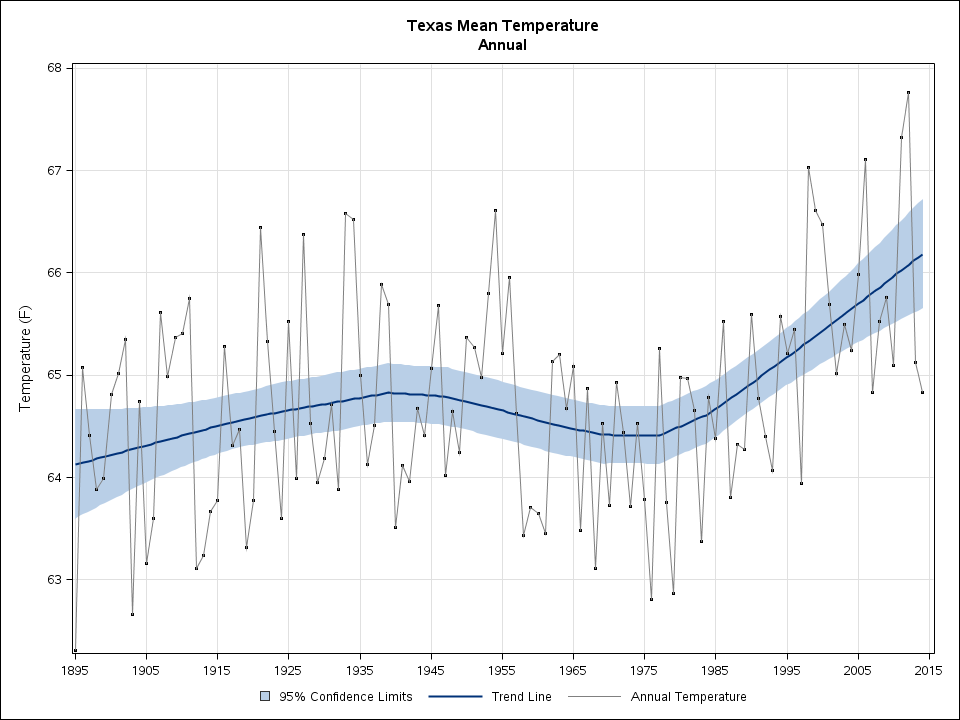
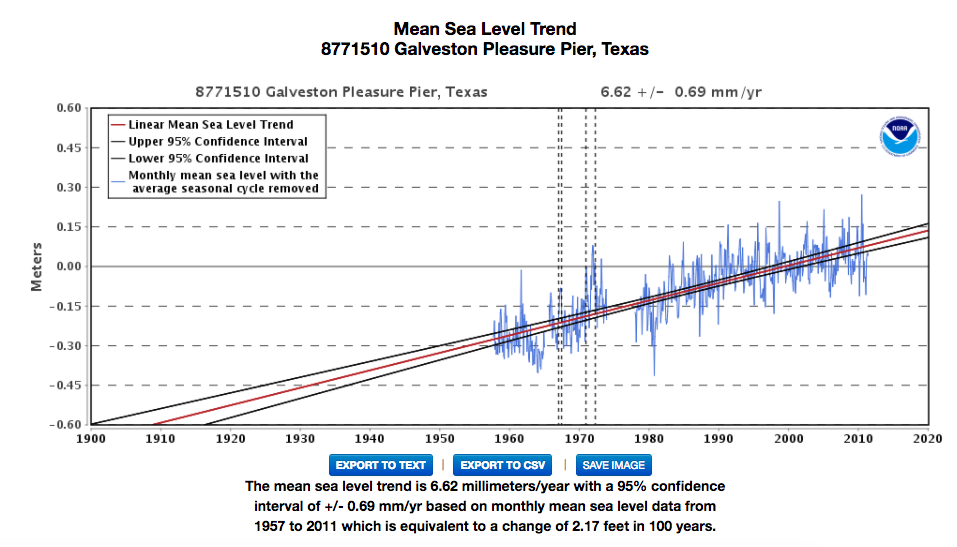
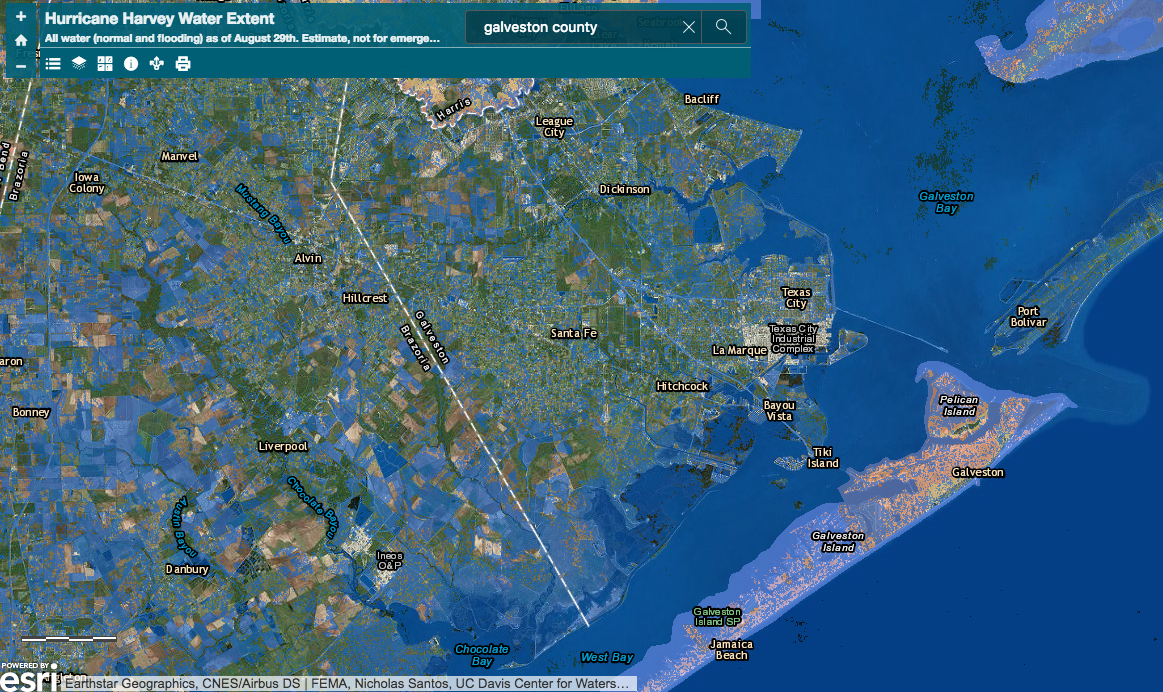
Article editor: Dr. Dagomar Degroot, Georgetown University Climate changes and the local environment:For decades, global warming has increased sea levels in most coastal regions. Glacial meltwater has poured into the oceans, while warming water has expanded, taking up more volume and therefore sending sea levels ever higher. Communities at risk of major tropical cyclones - such as Galveston county, Texas - have faced the full consequences of these changes to the world's oceans. Hurricanes are fueled by warm, moist air rising from warm water. The warmer the water, the more fuel hurricanes can use. While global warming has likely not increased the frequency of hurricanes overall, it has increased the frequency of exceptionally severe storms. Currently, powerful hurricanes are up to 11% stronger and more dangerous for communities such as Galveston. A hurricane's winds usually cause the greatest damage to human infrastructure by pushing ashore enormous quantities of water. These "storm surges" are highest in powerful hurricanes, which means that they are more frequently destructive now than they have been. Off Texas, rising sea levels have made them even worse. Between 1957 and 2011, sea levels off Galveston rose by just over a foot, which has greatly increased the damage that will be inflicted to the county in a major hurricane. How we know:This information is derived from the National Oceanic and Atmospheric Administration (NOAA) study that connects global warming and hurricanes. It also draws from easy to use tools that are available online: the NOAA State Annual and Seasonal Time Series, and the NOAA Tides and Currents resource. NOAA’s GFDL study on Global Warming and Hurricanes pulls data from published articles regarding hurricane intensity and temperature fluctuations since the 1800s. NOAA’s State Annual and Seasonal Time Series is derived from the current U.S. Climate Division Database that pulls data from temperature stations. NOAA’s Tides and Currents produces sea level trends measured from U.S. and Global Stations without the regular seasonal fluctuations due to coastal ocean temperatures, salinities, winds, atmospheric pressures, and ocean currents. Human consequences:Galveston became a major U.S. commercial center and one of the largest ports in America during the 19th century. Whenever a major hurricane hits the county, its lack of a sustainable drainage system leaves many of its streets inundated with water for weeks. Without adequate flood safety measures, today 320,000 people are forced to evacuate from their homes at the approach of a hurricane. When these people are displaced and Galveston’s port is flooded, millions of dollars in goods from the commercial port are lost. Thousands of businesses around the United States that receive imported materials through this port are also impacted. Because Galveston County has long had a major commercial port, it has a great deal of infrastructure that is vulnerable to hurricanes. In 1900, it endured the deadliest natural disaster in American history, when the 15-foot storm surge of the Galveston Hurricane killed up to 12,000 people. In 1970, Hurricane Celia, a Category 4 storm, came ashore near Galveston and inflicted nearly $6 billion of damage in 2017 USD. Then, in 2017, Hurricane Harvey inflicted $23 billion worth of property damage in Harris and Galveston counties alone. Galveston County is extremely vulnerable to intense hurricanes, increasing local temperatures, and rising sea levels. As hurricanes strengthen and sea levels rise, the county may be hard pressed to survive the twenty-first century. Further reading:Article author: Kiera McCrane, Georgetown University
Article editor: Dr. Dagomar Degroot, Georgetown University |




 RSS Feed