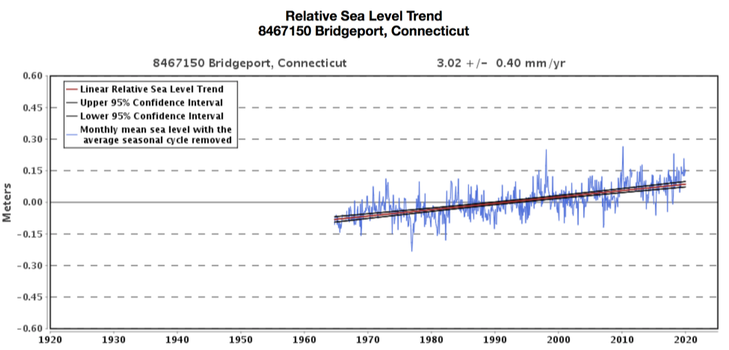
 Changes in sea level in Bridgeport, Connecticut from 1920 through today. Source: NOAA Tides and Currents Climate changes and the local environment:Over the past century, warming oceans have significantly accelerated the melting of polar ice sheets, releasing trillions of tons of freshwater into the ocean. This melt, coupled with the increased volume occupied by warm water, has gradually raised sea levels in Fairfield County. 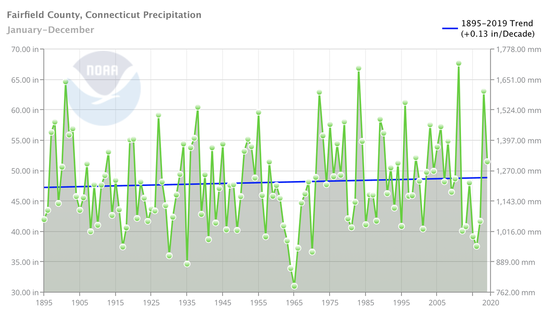 Average annual precipitation in Fairfield County from 1895 to the present. Source: NOAA Climate at a Glance. Bridgeport, one of largest cities in the county, has endured 5 inches of sea level rise since 1964. The county has also faced a real but erratic increase in annual precipitation. As global temperatures rise, the atmosphere is capable of holding more moisture, which in turn allows for more rainfall. 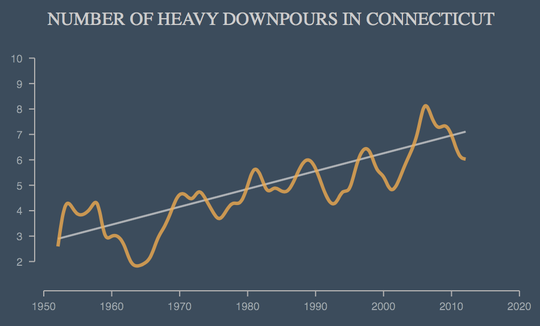 Graph displaying the overall upward trend of severe storms in Connecticut from the 1950's to the present. Source: Climate Central. More important than the modest trend in average precipitation in the county is a much more dramatic trend in heavy downpours since the 1950s. Torrential downpours, in addition to rising sea levels, have sharply increased the risk of flooding across Fairfield County. How we know: These reconstructions are based on easily-accessible online tools, including the National Oceanic and Atmospheric Administration’s (NOAA) Tides & Currents tool, the NOAA Climate at a Glance app, as well as Climate Central’s research report. NOAA’s Tides & Currents tool generates graphs of monthly mean sea levels for individual cities and counties. These graphs use sea level data collected from one of hundreds of sea level stations across the country, and include a long-term linear trend line. NOAA’s Climate at a Glance app uses data collected at weather stations and stored in NOAA's U.S. Climate Divisions database to create graphs about temperature, precipitation, and drought. This app can generate graphs that present global, regional, and local trends. Climate Central’s Heaviest Downpours research report displays the increase in heavy downpours in the United States. At each station, a heavy downpour was defined as the top 1 percent daily precipitation amounts over the period from 1950 to 2014. The analysis is based on precipitation observations from 2,962 climate stations across the US. Human consequences:Rising sea levels, an increase in overall precipitation, and more severe storms have greatly increased Fairfield County’s risk for floods. Over 130,000 people in the state are currently at risk of inland flooding, while heavy downpours and rising sea levels have strained the County’s sewer system. This stress on the County’s unprepared infrastructure has severely impacted both human and aquatic health. In particular, the rise in rain storms has increased levels of runoff. Within Fairfield County, the city of Bridgeport operates under a combined sewer system, meaning that rainwater runoff, domestic sewage, and industrial wastewater are all transported within the same pipe. During heavy storms where the rainfall exceeds the system’s capacity, the system is designed to overflow and release excess water into nearby bodies of water. These overflows, called combined sewer overflows (CSOs), have considerable impacts on the local environment of Fairfield County. CSOs present an environmental and public health risk for the County, as the untreated wastewater that is discharged can contain bacteria, raw sewage, excess nutrients from fertilizers, and chemicals. This particularly impacted Bridgeport, as portions of the city’s sewer system were built over 100 years ago. The Connecticut Department of Energy and Environmental Protection found that a CSO occurs whenever there is 0.4 inches of precipitation or more. Overflows from the system occur on average every 10 days, releasing between 100,000 and 500,000 gallons of contaminated water into local rivers, streams, and harbors. With the increasing rate at which heavy downpours are taking place in Bridgeport, this leaves the public exposed to bacteria and raw sewage, creating a considerable health risk. The increasingly high levels of contamination have also undermined recreational activity, often leading to the closure of multiple beaches and parks. In Bridgeport the following parks, beaches, and harbors are constantly affected: Ash Creek, Bridgeport Harbor, Black Rock Harbor, Pequonnock Harbor, Johnson’s Creek, Yellow Mill Pond, Cedar Creek, Burr Creek, and Island Brook. Moreover, the loss of fishing grounds in Bridgeport has greatly disturbed the fishing industry. Leaked sewage has and will continue to kill tens of thousands of acres of shellfish beds. Additionally, hypoxia, or the overgrowth of algae that leads to dangerously low levels of oxygen for aquatic life, will continue to appear throughout the County as excess fertilizers enter these ecosystems. These “dead zones” are detrimental for aquatic species and will only further degrade the County’s water quality. Fairfield County, and specifically the Bridgeport Water Pollution Control Authority (WPCA), have already taken measures to combat the damages from CSOs. The WPCA has developed a plan to minimize the number of CSOs, and has implemented green infrastructure to prevent or delay stormwater from entering the sewer system. Although these efforts have helped reduce the number of overflows, Fairfield County nevertheless must invest in more infrastructure and a new system in order to mitigate the damages caused by stormwater runoff and severe floods. Further reading:Some CT beaches considered among the dirtiest. EyeWitness News Water quality at Bridgeport, Fairfield beaches dropped in 2016. CT Post Bridgeport plans massive sewer upgrades. CT Post Combined Sewer Overflow Guide for City Employees. Bridgeport WPCA Article author: James Loughran, Georgetown University
Article editor: Maddie Bowen, Georgetown University
2 Comments
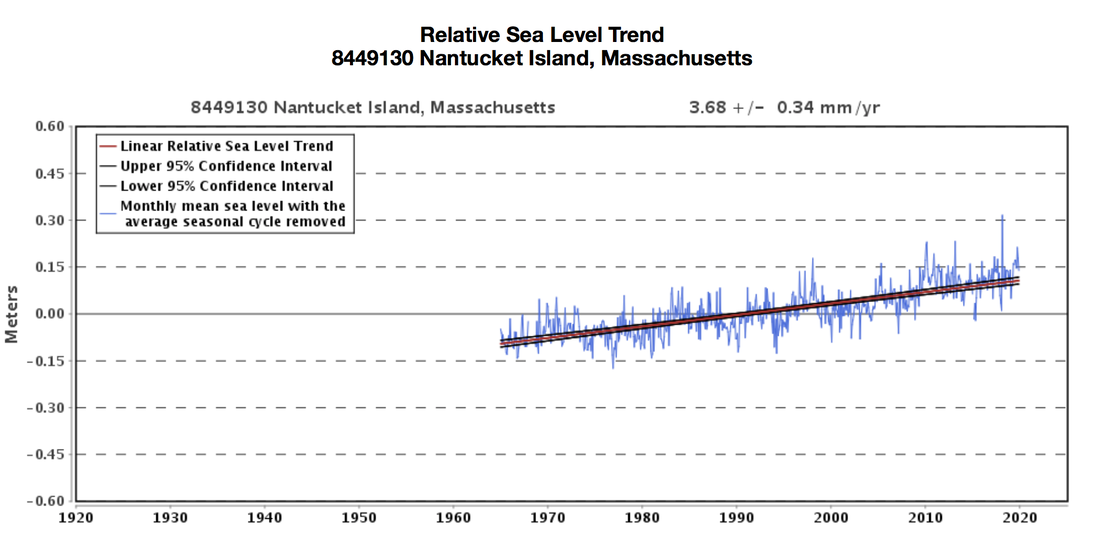 Changes in sea level in Nantucket County, Massachusetts from 1965 through today. Source: NOAA Tides and Currents. Climate changes and the local environment:As the amount of greenhouse gases in the atmosphere continues to increase, the average global temperature will increase as well. With an intermediate-low emission scenario, it is predicted that we could see an increase of 2 ̊C by 2100. Under the most extreme emissions scenario, average annual temperatures could rise by up to 4 ̊C in the coming century. Both emissions scenarios – either a 2 ̊C or 4 ̊C increase – will lead to global sea level rise. This increase in sea levels has two direct causes. First, thermal expansion of the world’s oceans occurs as average global temperatures, and thus oceanic temperatures, rise. This leads to an increase in kinetic energy of the water. This increase in molecular movement then causes an expansion in the water’s volume. Second, rising temperatures will speed up the melting of ice caps in Greenland and Antarctica. This melting will add more water to the Earth’s oceans and raise sea levels. Nantucket Island will continue to face extreme regional impacts as sea levels continue to rise. Given its location as an island off the coast of Massachusetts, Nantucket is especially susceptible to the effects of rising sea levels. If global temperatures increase by 2°C, Nantucket could see up to 10 feet of sea level rise. If temperatures increase by 4°C, oceans surrounding the County could rise by as much as 19 feet. In both emissions scenarios, all of historic Nantucket - a community hundreds of years old - would be underwater; however, with a rise in sea levels of 19 feet, a significant portion of the island could become submerged. 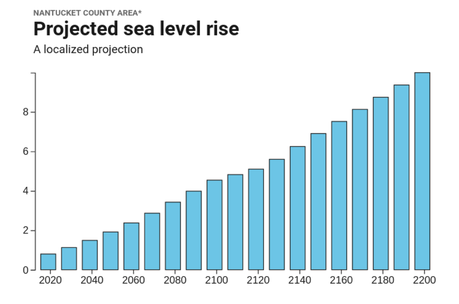 Projected sea level rise in Nantucket County under an intermediate-low emissions scenario. Source: Surging Seas Risk Finder. 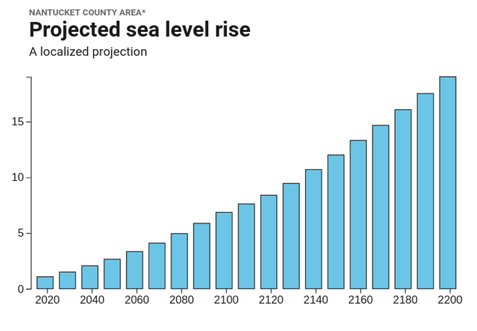 Projected sea level rise in Nantucket County under a high emissions scenario. Source: Surging Seas Risk Finder. The impacts of rising sea levels in Nantucket County will be intensified by coastal erosion. Nantucket is already losing coastal land at alarming rates due to the weathering of shorelines, a phenomenon exacerbated by potentially worsening hurricanes. Additionally, Nantucket County is an island composed of compacted sand, only making it more susceptible to coastal erosion. Portions of the island’s shorelines have already lost more than one hundred feet of coast depth in just the past decade. As global temperatures continue to rise, it will not just cause much of Nantucket to be below sea level, it will also speed up the erosion process until the island itself could cease to exist. How we know:These projections primarily rely on the free and easily accessible Tides and Currents tool by The National Oceanic Atmospheric Administration (NOAA) and Climate Central’s Surging Seas: Risk Finder projections. NOAA’s Tides and Currents resource uses data collected from over 140 long-term water level stations to reconstruct local relative sea level trends. These measurements are averaged monthly in order to present an accurate linear sea level trend. Climate Central’s Surging Seas: Risk Finder generates projections for sea level rise, as well as flood risks, based on the different emissions scenarios in the NOAA Technical Reports. This tool generates the projections for Nantucket County using data from the Nantucket sound water level station, located 2 miles from central Nantucket. Human consequences:The year-round population in Nantucket County is approximately 12,000 individuals; however, due to tourism, the population swells to 60,000 during the summer months. The County has more than 800 buildings and structures which were built before the Civil War and are historically preserved through the island’s local governance. The majority of these preserved buildings were built around Nantucket Harbor, the historic hub of the island’s once-famous whaling industry. It is this harbor, along with the surrounding historic buildings, that will likely be submerged underwater, with even a 2°C global temperature increase, if decisive actions are not taken. Additionally, the majority of the County’s prime real estate is located along the coast. Under a low emissions scenario, the total value of homes in Nantucket at risk of rising sea levels and increased floods could reach $990,000,000 by 2050. As a result of the severe erosion that Nantucket has already experienced, many of the island’s most valuable properties and historic landmarks - including some of the United States’ oldest lighthouses - have had to undergo relocation. Moving these properties to inland sites will temporarily protect the structures, but this process has cost residents on the island millions of dollars and, if sea levels continue to rise, will result in future costs for decades to come. The most recent and effective, yet expensive, solution to this problem is the installation of geotubes. Geotubes are two hundred feet long, seven-and-a-half feet tall, and 20 feet wide. Stacked four high, they line the island’s beaches where erosion is most severe. While designed to withstand the force of the nonstop waves and stay firmly in place, the geotubes are covered with additional sand to make the engineered bluff look as natural as possible. Geotube sand coverage also contributes sand to the natural erosion process without risking further destruction of the island’s beaches. Ultimately, Nantucket County’s fate depends greatly on how quickly and effectively measures can be taken to combat rising global temperatures and sea level rise. If emissions continue at the current rate, Nantucket Island will likely cease to exist and with it, the highly lucrative tourism industry and centuries of history. Further reading:Nantucket's Bluffs and Beaches are Crumbling in the Face of Storms and Rising Seas. PRI Chronicle: Fighting Erosion on Nantucket. WCVB More Details on Geotubes. Siasconset Beach Preservation Fund Article author: Benny Weisman, Georgetown University
Article editor: Maddie Bowen, Georgetown University Climate changes and the local environment: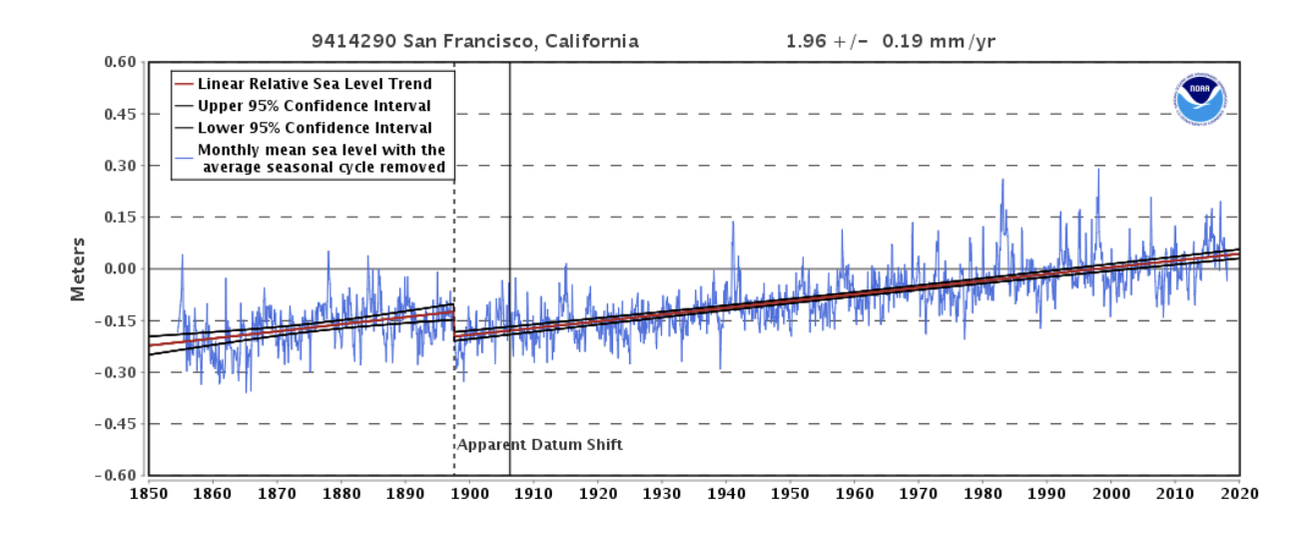 Changes in sea level in San Francisco, California, from 1850 through today. Source: NOAA Tides and Currents. Over the past century, Marin County has experienced eight inches of sea level rise, and by 2100 could ultimately see an increase of 16.6 to 65.8 inches. Global sea level rise, prompted by increased concentrations of atmospheric greenhouse gases such as carbon dioxide, can be attributed to two main factors: Arctic ice caps are melting, and oceans are warming thus expanding in volume. The most extreme emission scenario, which represents the worst possible future scenario, projects a 4ºC increase in temperatures and a global sea level rise of 8.9 meters. If current global emissions are restricted and warming is limited to 1.5ºC, global sea levels are still projected to rise by 2.9 meters. Marin County’s location on the coast of California makes it highly susceptible to the impacts of global sea level rise. The projected increase in sea levels will threaten beaches and wetlands, introduce salt water to inland areas, and displace native coastal organisms. In Marin County, 13,774 acres of land have already been declared vulnerable to the threats of sea level rise. 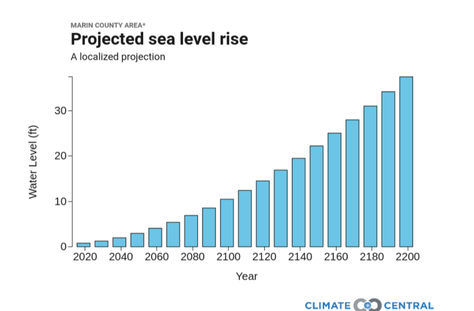 Projected sea level rise in Marin County based on extreme emission scenarios from NOAA. Source: Climate Central Risk Finder. 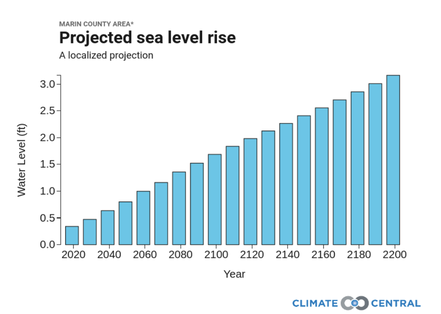 Projected sea level rise in Marin County based on intermediate-low emission scenarios from NOAA. Source: Climate Central Risk Finder. Rising sea levels will increase the frequency and intensity of flooding, and the damages will be worsened due to large coastal storms. These storms will also become more severe, as the warming atmosphere is capable of holding more moisture. California is especially prone to infrequent, intense rain events, and often receives the majority of its annual precipitation in only one or two large storms. Sea level rise, combined with more intense storms and floods, will fundamentally alter Marin County’s environment by accelerating erosion, introducing saltwater to inland environments, and drastically altering coastal species’ habitats. In some cases, rising tides will make a portion of the County disappear completely. 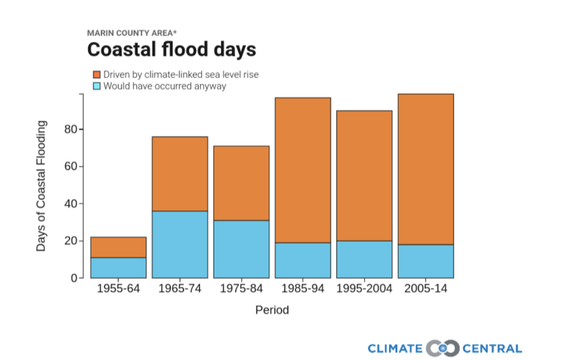 Reconstructions of the percentage of coastal flooding days that can be attributed to climate-linked sea level rise and to unrelated forces from 1950 to the present. Source: Climate Central Risk Finder. How we know:These projections and reconstructions are based on freely accessible online tools from The National Oceanic and Atmospheric Administration (NOAA) Tides and Currents tool and the Climate Central Surging Seas: Risk Finder projections and tools. The NOAA Tides and Currents resource reports local mean sea level changes from 1850 to today. It uses data collected from U.S. and global water level stations to reconstruct local sea level trends. The Climate Central Surging Seas tool generates sea level projections based on the different emissions scenarios presented in the NOAA Technical Reports. This tool uses data from the San Francisco water level station to generate the coastal flood days graph. Human consequences:Rising sea levels and worsening floods will pose health threats to the residents of Marin County and may require citizens to relocate. Furthermore, it is likely these factors will compromise the County’s water quality. Occasionally, increased flooding could improve water quality due to water percolation through the soil; however, prolonged flooding more often stresses or over floods the soil, ultimately degrading water quality. With more frequent floods, salt water, excess nutrients from fertilizers, and sediment from erosion are expected to enter the groundwater in Marin County. In addition, the current storm water drainage will not be suited to handle more severe storms, causing flooding in the streets. This will also threaten human health, as it increases the risk that sewage systems will overflow and contaminate groundwater. Rising sea levels will also affect the properties in Marin County that are currently on the coast. In a lower emissions scenario projecting three feet of sea level rise, $4.2 billion worth of properties will be compromised. In an extreme emission scenario that forecasts 10 feet of sea level rise, property damages will reach nearly $9.3 billion. In 2016, the Public Policy Institute of California reported that one in five Californians lives in flood-prone areas. The costs to replace this vulnerable infrastructure could exceed $575 billion, as an increasing number of buildings will be in high-risk zones. As the effects of sea level rise and severe floods worsen in Marin County, residents and the local government must take steps to reduce current damages and to minimize future impacts. In response to increased flooding, Marin County has already widened creeks to reduce erosion, support higher water levels during floods, and restore wetlands. To combat sea level rise, Marin County has implemented structural defenses, such as floodwalls, levees, and tidal gates. Additionally, as the County recognizes that many future impacts cannot be mitigated, it promotes adaptive measures such as building elevated structures, relocation of at risk infrastructure, and planned retreats. The County’s website also includes an extensive action plan detailing flood prevention procedures and emergency protocols. As the impacts of severe floods and rising sea levels intensify, Marin County must continue to promote methods to mitigate and adapt to these changes. Further reading:California's Water. Public Policy Institute of California Flood Protection. Marin Watersheds Sea Level Rise. Marin Watersheds Article author: Esther Doerr, Georgetown University
Article editor: Maddie Bowen, Georgetown University 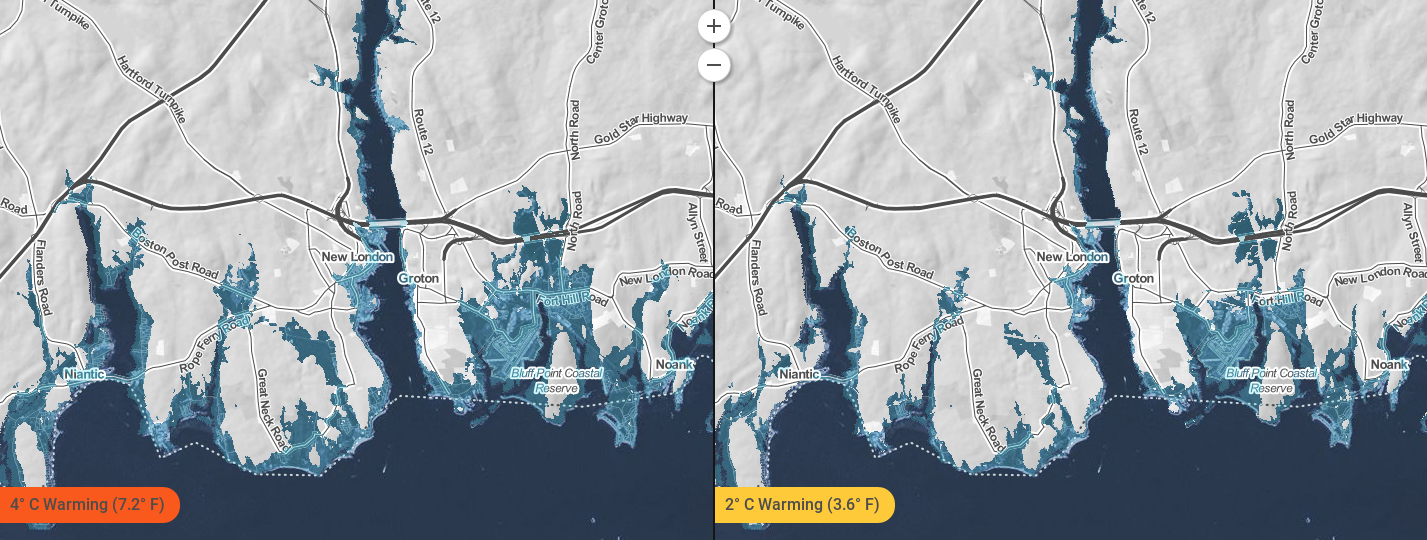 Changes to the New London County coastline under two different emissions scenarios. Source: Climate Central Surging Seas: Mapping Choices. Climate changes and the local environment:Mean global sea levels have risen by at least 17 centimeters (nearly 7 inches) in the twentieth century. Yet regional variations in ocean temperatures, prevailing winds, ocean currents, and the rise or fall of Earth's crust mean some areas have experienced, and will experience, greater sea level increases than others. Off Connecticut, for example, sea levels are today increasing more quickly than the global average. Connecticut is in fact sinking as its crust slowly recovers from the immense weight of glaciers that covered it during the last ice age. Connecticut is sinking by over 0.03 inches per year, even as Earth's ocean rise. Rising sea levels and sinking land will have dire consequences for the environment of New London County in Connecticut. Low-lying coastal lands in and around the county will eventually be inundated, overwhelming natural flood and storm barriers such as beaches and wetlands. That will make the county ever more vulnerable to coastal storms and flooding, which will grow more frequent and severe as Earth's climate warms. In fact, the Connecticut Governor’s report predicts that by 2050, New London County may face a 100-year storm every 56 years. A 100-year storm refers to a storm of such rarity and magnitude that it has only a 0.1 percent chance of happening in New London County in any given year. Meanwhile, precipitation is on the rise in New London County as local temperatures warm. Hotter air holds more water vapor than cold air, so it is no surprise that average annual precipitation is increasing, while extreme precipitation events - such as torrential rains - are growing more frequent. Both trends are expected to accelerate in the future. Stronger storms sweeping in from the sea are therefore projected to bring more coastal floods in the warmer future, while heavier rains lead to more river floods in New London County. 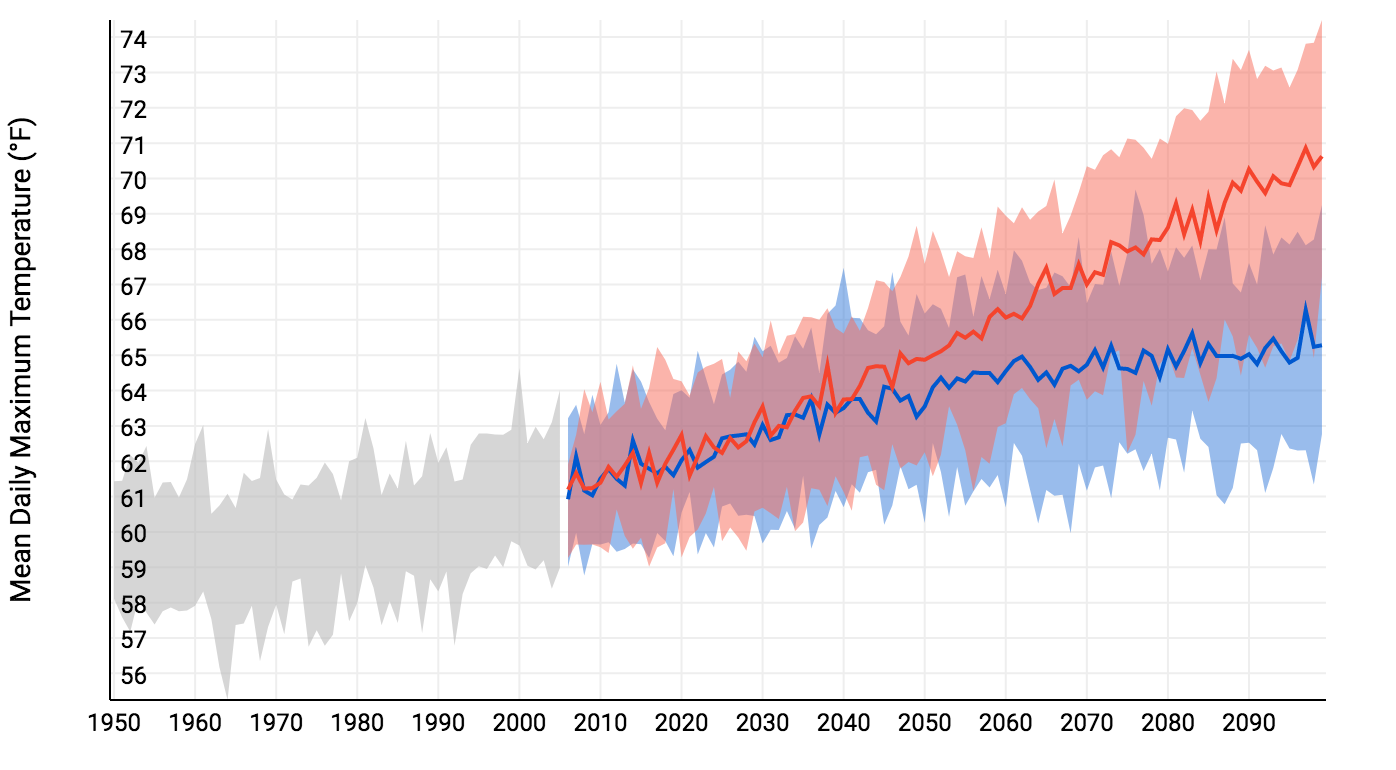 Past and projected changes to the daily high in New London County. Red shows the projection for a future with higher emissions, and blue with lower emissions. Source: NOAA U.S. Climate Resilience Toolkit (Climate Explorer). How we know:These predictions are based on four easy to use tools that are freely accessible online: National Oceanic and Atmospheric Administration (NOAA) Sea Level Trends app, the NOAA Climate Explorer app, and the Climate Central Surging Seas, Mapping Choices app, and the Aqueduct Global Flood Analyzer. The Sea Level Trends tool shows regional mean sea level changes from the twentieth century through today. NOAA collects data for these measurements through the 142 long-term tide stations of the National Water Level Observation Network, which has been measuring sea level for over 150 years. Each regional mean sea level rise or fall is computed using a minimum of 30 years of data to ensure accuracy. The Climate Explorer tool uses weather information recorded by meteorological instruments at weather stations to reconstruct past climate changes. It uses supercomputer simulations of future climate changes under both high and low emissions scenarios. The Surging Seas tool combines historic flood statistics and local sea level trends with global scenarios of sea level increases, which were compiled in the 2014 U.S. National Climate Assessment. The Global Flood Analyzer estimates the vulnerability of regions to flooding, providing figures for the cost of flood damage and number of people affected. 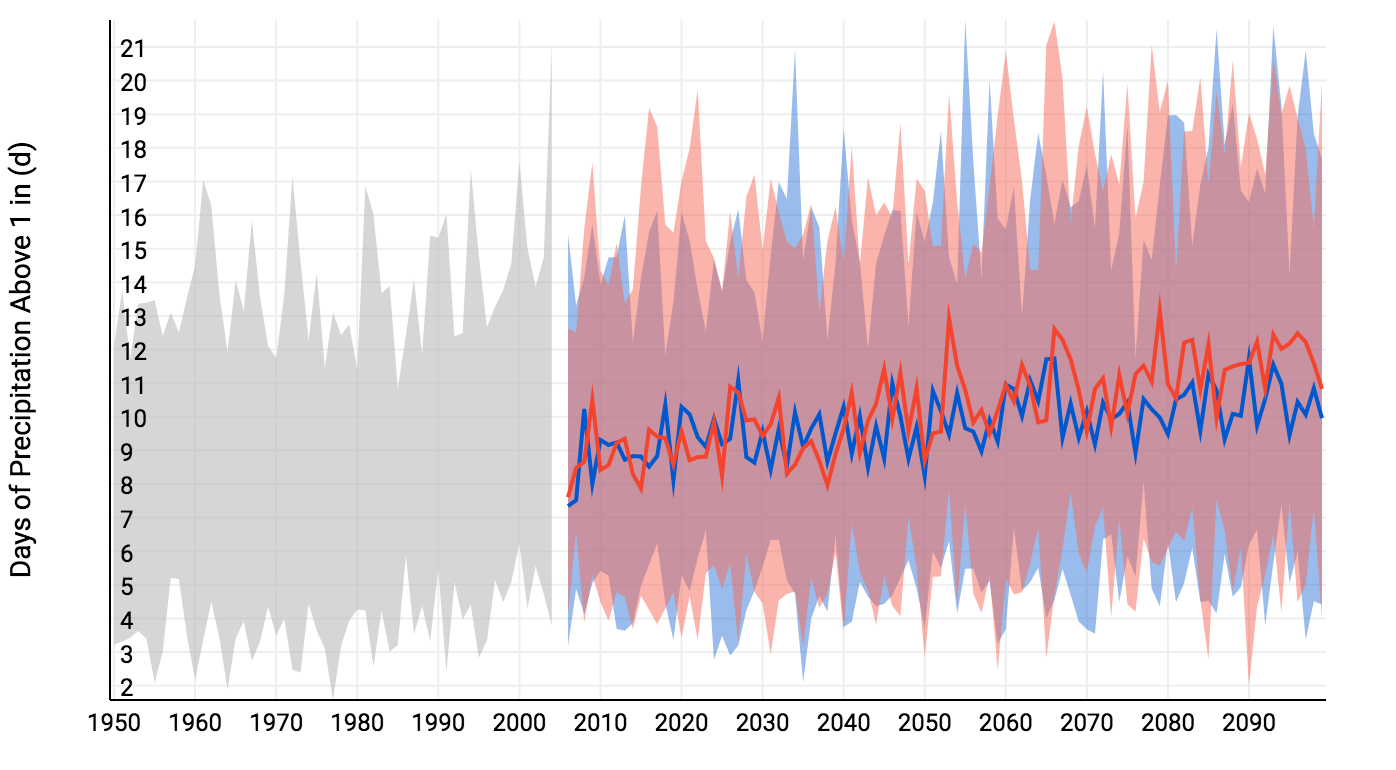 Past and projected days, per year, with more than one inch of precipitation in New London County. Red shows the projection for a future with higher emissions, and blue with lower emissions. Source: NOAA U.S. Climate Resilience Toolkit (Climate Explorer). Human consequences:New London County is already coping with climate change. In 2010, New London endured a 100-year flood after heavy rains caused rivers to spill their banks and ground water to overflow sewage systems. The Federal Emergency Management Agency (FEMA) estimated that the flood cost the county $5.3 million in losses and damages. Precipitation trends will make such floods more common. In New London County, a total of 4,306 residents currently live in homes that are less than 6 feet above sea level. By 2030, there is a 67% chance that flood with waters 6 or more feet above sea level will occur, which would put all these lives and homes at risk. Increased intensity and frequency of both coastal storms and flooding is hugely detrimental to infrastructure and business in New London County. In particular, the Naval Submarine base and the General Dynamics Electric Boat Corporation submarine construction yard, which is the primary builder of submarines for the U.S. Navy, are at risk from sea level rise, storms, and flooding. These establishments are essential to the county’s economy and to national security. Re-engineering of the base and the submarine construction yard may be necessary in order to keep them functional in the face of rising sea levels, yet this would be staggeringly expensive. The consequences of climate change and global warming have already harmed many of coastal communities in New London County. Under all future emissions scenarios, even very optimistic ones, further damage is all but inevitable. Further reading:Climate Change Primer - Sea Level Rise and Coastal Storms. State of Connecticut Climate Suggests Floods will Probably Happen Again. The Day Article author: Georgia Brainard, Georgetown University
Article editor: Dr. Dagomar Degroot, Georgetown University 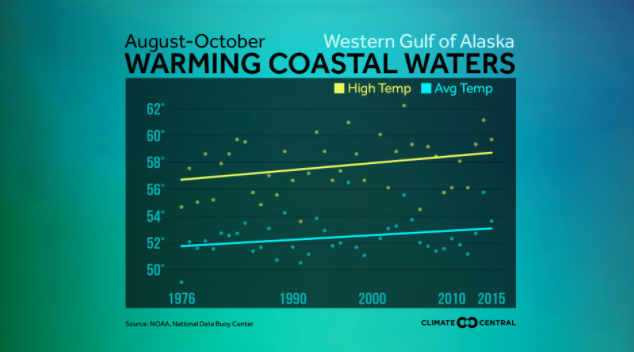 Average and annual high temperatures in the waters of the Western Gulf of Alaska, 1976-2015. Climate changes and the local environment:Between 2013 till early 2017, the east pacific along the west coast of the United States experienced incredibly high temperatures. In 2013, a patch of alarmingly warm water developed along the Gulf of Alaska, due to a force called “The Blob.” The Blob was a patch of warm air that built up when decreased winds failed to distribute and cool the sea surface. In January of 2014, a natural cycle called the Pacific Decadal Oscillation (PDO) shifted to a warm phase and began adding to the pre-existing heating from the Blob. The PDO naturally alternates between periods of warming and periods of cooling along the Gulf of Alaska, and in 2014 it began a warming trend that continued into 2016. However, while the PDO is a natural cycle, it is likely that it has been increasingly impacted by human caused climate changes in the last 30 years. Human actions, such as greenhouse gas emissions, have led to increases in temperature, which intensify the natural warming of the PDO. While they have already begun to have an impact on Sitka and the Gulf of Alaska, these human effects will only continue to magnify the PDO’s effect further in the next few decades, as sea surface temperatures continue to increase. Because of the high temperatures in the Gulf of Alaska, a toxic algae bloom formed along the coast of Sitka and lasted longer than normal. Algae flourishes in hot areas, so the unusually warm trend was perfect for growth. 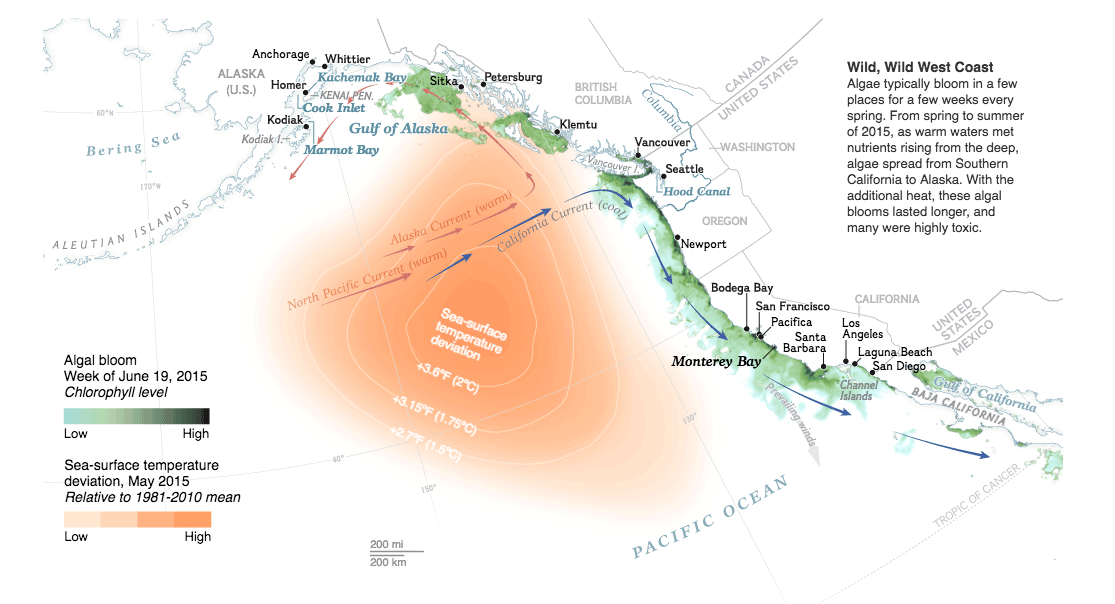 Warm sea surface temperatures and toxic algae off Alaska, 2015. Source: Lauren E. James, NGM Staff; Nick Bond, University of Washington; Raphael Kudela, University of California Santa Cruz. How we know:The warming trends seen in the Gulf of Alaska between 2013 and 2016 can be accessed online through various sources, such as the National Oceanic and Atmospheric Administration (NOAA) Northwest Fisheries Science Center and the NOAA National Data Buoy Center. NOAA’s buoy data has been organized in this article to show the rising temperatures along the United State’s coastal waters. NOAA’s data on sea surface temperature is gathered from satellites observations and from drifting buoys stationed along coasts that collect temperatures at different depths. Data on algal blooms is collected by sampling water along the coast and counting the algae present in the sample. This article from National Geographic shows the trend between the increased temperatures starting in 2013 and algal blooms. Large scale changes in climate such as the PDO can be modeled by combining measurements of sea ice, taken by satellite measurements, with sea surface temperatures overtime. This study from the journal Climate Dynamics uses these two measurements to discuss the likely connection between human caused warming and magnified PDO cycles. Human consequences:The increase in temperature along the coast of Sitka killed zooplankton on a large scale. With zooplankton populations low, animals that rely on plankton for food and others further up the food chain, like starfish, sea birds, whales, and sea otters, experienced large die offs. These trends also impacted the Coho salmon populations, leading to a harvest in 2016 that was below the 10 year average. Impacts of the warming trend in 2015 and 2016 will not be observed for the Chinook salmon until later in 2017, but they are predicted to have a similarly negative impact. In an economy where 1 in 10 jobs are supported by salmon, decreases in Salmon production have major impacts on the community. The large-scale algal bloom also put Sitka’s subsistence harvesters at risk. The toxic algae collect in the body of shellfish as water filters through them. When people harvest and eat infected shellfish, the toxins from the algae can cause symptoms as severe as brain damage or death. The first death in Sitka recorded as a result of poisoned shellfish appeared in 1799 and more have continued to pop up throughout the years. Large-scale algal blooms, like the one in 2015, spread the toxins and put the harvesters of Sitka at risk. Shellfish that is collected on the Sitka shore provide a cheap source of protein that is becoming increasingly vulnerable. While the effects of the Blob and PDO began receding in 2017, they foreshadowed how the ocean will look in a warming world. For the people of Sitka in particular, a warmer ocean could undermine local food sources and employment. Further reading:Paralytic Shellfish Poisoning (PSP) Warning Issued for Southeast Alaska. Sitka Local Foods Network Harmful Algal Blooms—Exacerbated by Warming Ocean Temperatures. U.S. Climate Resilience Toolkit Run Forecasts and Harvest Projections for 2017 Alaska Salmon Fisheries and Review of the 2016 Season. Alaska Department of Fish and Game Article author: Eve Kelly, Georgetown University
Article editor: Dr. Dagomar Degroot, Georgetown University |
 RSS Feed