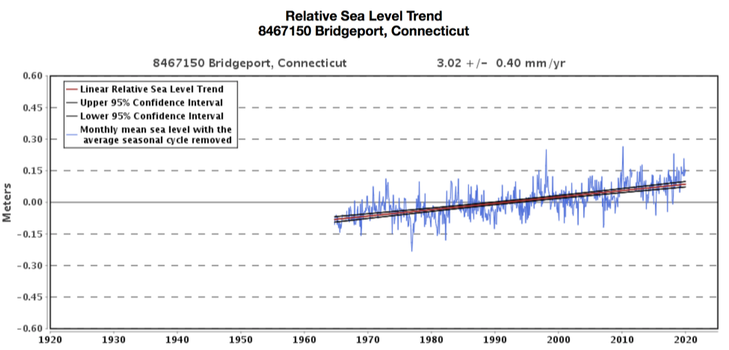
 Changes in sea level in Bridgeport, Connecticut from 1920 through today. Source: NOAA Tides and Currents Climate changes and the local environment:Over the past century, warming oceans have significantly accelerated the melting of polar ice sheets, releasing trillions of tons of freshwater into the ocean. This melt, coupled with the increased volume occupied by warm water, has gradually raised sea levels in Fairfield County. 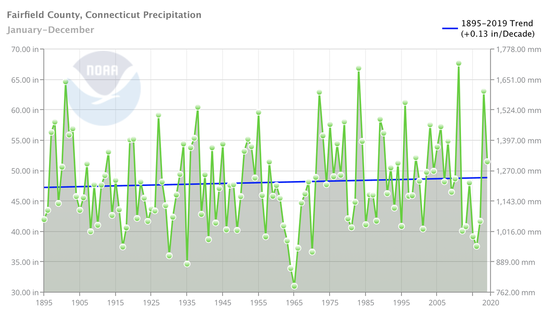 Average annual precipitation in Fairfield County from 1895 to the present. Source: NOAA Climate at a Glance. Bridgeport, one of largest cities in the county, has endured 5 inches of sea level rise since 1964. The county has also faced a real but erratic increase in annual precipitation. As global temperatures rise, the atmosphere is capable of holding more moisture, which in turn allows for more rainfall. 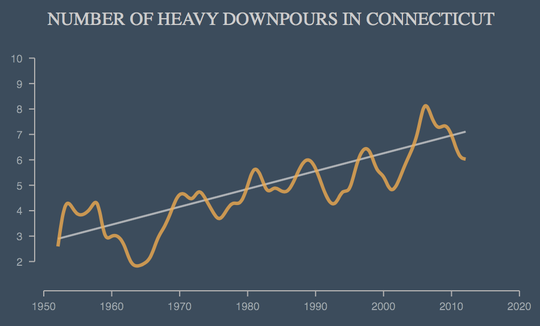 Graph displaying the overall upward trend of severe storms in Connecticut from the 1950's to the present. Source: Climate Central. More important than the modest trend in average precipitation in the county is a much more dramatic trend in heavy downpours since the 1950s. Torrential downpours, in addition to rising sea levels, have sharply increased the risk of flooding across Fairfield County. How we know: These reconstructions are based on easily-accessible online tools, including the National Oceanic and Atmospheric Administration’s (NOAA) Tides & Currents tool, the NOAA Climate at a Glance app, as well as Climate Central’s research report. NOAA’s Tides & Currents tool generates graphs of monthly mean sea levels for individual cities and counties. These graphs use sea level data collected from one of hundreds of sea level stations across the country, and include a long-term linear trend line. NOAA’s Climate at a Glance app uses data collected at weather stations and stored in NOAA's U.S. Climate Divisions database to create graphs about temperature, precipitation, and drought. This app can generate graphs that present global, regional, and local trends. Climate Central’s Heaviest Downpours research report displays the increase in heavy downpours in the United States. At each station, a heavy downpour was defined as the top 1 percent daily precipitation amounts over the period from 1950 to 2014. The analysis is based on precipitation observations from 2,962 climate stations across the US. Human consequences:Rising sea levels, an increase in overall precipitation, and more severe storms have greatly increased Fairfield County’s risk for floods. Over 130,000 people in the state are currently at risk of inland flooding, while heavy downpours and rising sea levels have strained the County’s sewer system. This stress on the County’s unprepared infrastructure has severely impacted both human and aquatic health. In particular, the rise in rain storms has increased levels of runoff. Within Fairfield County, the city of Bridgeport operates under a combined sewer system, meaning that rainwater runoff, domestic sewage, and industrial wastewater are all transported within the same pipe. During heavy storms where the rainfall exceeds the system’s capacity, the system is designed to overflow and release excess water into nearby bodies of water. These overflows, called combined sewer overflows (CSOs), have considerable impacts on the local environment of Fairfield County. CSOs present an environmental and public health risk for the County, as the untreated wastewater that is discharged can contain bacteria, raw sewage, excess nutrients from fertilizers, and chemicals. This particularly impacted Bridgeport, as portions of the city’s sewer system were built over 100 years ago. The Connecticut Department of Energy and Environmental Protection found that a CSO occurs whenever there is 0.4 inches of precipitation or more. Overflows from the system occur on average every 10 days, releasing between 100,000 and 500,000 gallons of contaminated water into local rivers, streams, and harbors. With the increasing rate at which heavy downpours are taking place in Bridgeport, this leaves the public exposed to bacteria and raw sewage, creating a considerable health risk. The increasingly high levels of contamination have also undermined recreational activity, often leading to the closure of multiple beaches and parks. In Bridgeport the following parks, beaches, and harbors are constantly affected: Ash Creek, Bridgeport Harbor, Black Rock Harbor, Pequonnock Harbor, Johnson’s Creek, Yellow Mill Pond, Cedar Creek, Burr Creek, and Island Brook. Moreover, the loss of fishing grounds in Bridgeport has greatly disturbed the fishing industry. Leaked sewage has and will continue to kill tens of thousands of acres of shellfish beds. Additionally, hypoxia, or the overgrowth of algae that leads to dangerously low levels of oxygen for aquatic life, will continue to appear throughout the County as excess fertilizers enter these ecosystems. These “dead zones” are detrimental for aquatic species and will only further degrade the County’s water quality. Fairfield County, and specifically the Bridgeport Water Pollution Control Authority (WPCA), have already taken measures to combat the damages from CSOs. The WPCA has developed a plan to minimize the number of CSOs, and has implemented green infrastructure to prevent or delay stormwater from entering the sewer system. Although these efforts have helped reduce the number of overflows, Fairfield County nevertheless must invest in more infrastructure and a new system in order to mitigate the damages caused by stormwater runoff and severe floods. Further reading:Some CT beaches considered among the dirtiest. EyeWitness News Water quality at Bridgeport, Fairfield beaches dropped in 2016. CT Post Bridgeport plans massive sewer upgrades. CT Post Combined Sewer Overflow Guide for City Employees. Bridgeport WPCA Article author: James Loughran, Georgetown University
Article editor: Maddie Bowen, Georgetown University
2 Comments
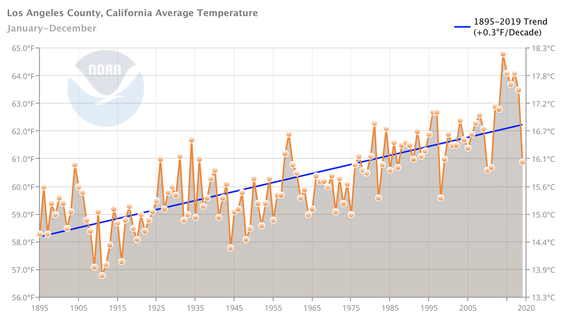 Average annual temperatures in Los Angeles County from 1895 to 2020. Source: NOAA Climate at a Glance. Climate changes and the local environment:Within the past century, the average temperature in Los Angeles County has increased by 3˚C. The number of days with a maximum temperature above 90˚ F has increased steadily over the past 20 years and is projected to continue rising. In addition to warmer average temperatures, Los Angeles County has experienced a decrease in precipitation during the fall and winter seasons. Increasing temperatures and decreasing levels of precipitation have increased the County’s risk for more severe droughts, as well as wildfires. 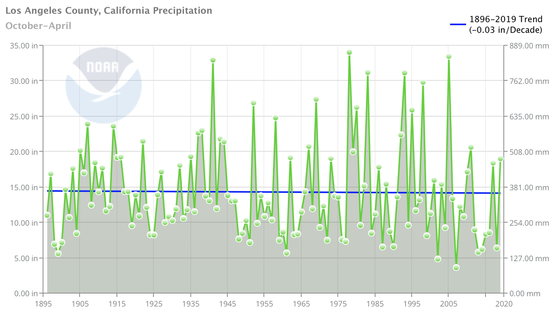 Average precipitation during the months of October to April in Los Angeles County from 1895 to 2020. Source: NOAA Climate at a Glance. Los Angeles County receives the majority of its annual rainfall during the late fall through early spring, then experiences a dry season during the summer months. The amount of winter season precipitation Los Angeles experiences has decreased over the past century, and this decline is predicted to continue. This reduction in rainfall means that there is less moisture in the soil at the beginning of the summer, which is the County’s dry season. The water evaporates from the soil and plants during the summer, and less winter precipitation ultimately leaves the vegetation drier earlier in the year. 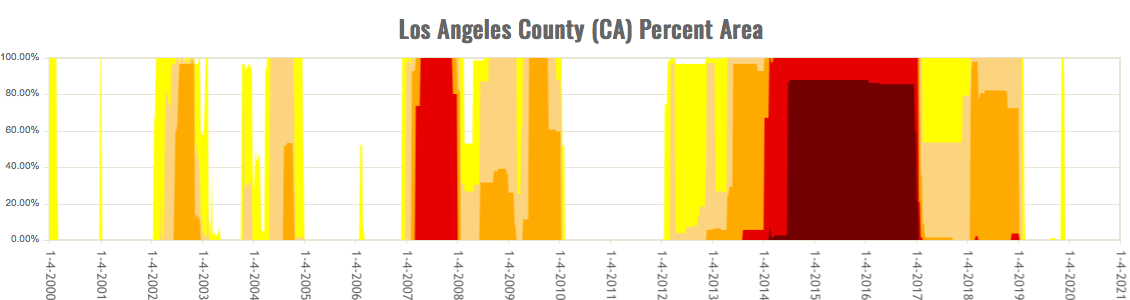 Drought severity in Los Angeles County from 2000 to 2020. Darker colors represent more severe droughts. Source: United States Drought Monitor. In addition to lower levels of rainfall, rising temperatures are reinforcing dryer and hotter summers in Los Angeles County. Higher annual temperatures lead to earlier snowpack melting, meaning that the winter season is shorter, there is less moisture in the soil during the dry season, and that the dry season is even longer. Warming temperatures also speed up evaporation, thus drying out the soil and parching the trees and vegetation. Drier and hotter summers have increased Los Angeles County’s drought risk, and by 2050 California’s risk of summertime drought is expected to almost triple. California’s dry and hot summers have always made the state more vulnerable to wildfires; however, rising temperatures and lower levels of precipitation have made the fire seasons longer and more severe. Los Angeles County’s fire season has already lengthened by approximately 75 days, and will likely increase in the future as well. With a longer and wetter winter season, Los Angeles County’s vegetation would soak up moisture which could help prevent summertime wildfires. This moisture dried out slowly through the summer season until it could be replenished the following fall. However, because the summer season has grown longer and hotter, and fall and winter rainfalls have decreased, flammable tinder has accumulated to high levels. Moreover, fire suppression over the last several decades has only added to the dangerous levels of tinder that has been available, and will continue to be available, to burn. How we know:These reconstructions are based on two easy to use tools that are freely accessible online: the National Oceanic and Atmospheric Administration (NOAA) Climate at a Glance tool and National Drought Mitigation Center's United States Drought Monitor. NOAA's Climate at a Glance tool uses data collected at weather stations and stored in NOAA's U.S. Climate Divisions database. This data is used to generate graphs about temperature, precipitation, and droughts, with the ability to look at global, national, and local averages. The Drought Monitor produces maps of drought conditions across the United States and publishes them weekly. The tool combines climate, soil, and water data with reports from 350 experts across the country. This generates an assessment of current drought conditions nationally, with the ability to look at data for individual states or counties. Human consequences:Warmer average temperatures, dryer seasons, and changing seasonal time frames have increased the number of wildfires in Los Angeles County, as well as in the intensity of the flames. Of the 20 largest fires to ever occur in California, two of them occurred in the last 10 years in Los Angeles County: the Thomas Fire in 2017 and the Station Fire in 2009. Over the past 50 years, summertime forest fires in the state have increased in size by approximately 800%, and 11.2 million residents in California currently live in areas with elevated risk for wildfires. Residents of Los Angeles County have already experienced the severe impacts of these wildfires. Wildfires release toxic smoke into the air, leaving dangerous air quality conditions, ash, and debris in their wake. Additionally, as wildfires rapidly spread, citizens can be forced to evacuate and in the worst situations, can lose their properties and homes to the fires. In 2018, the worst year of California wildfires on record, fires destroyed over 24,000 homes and buildings in the state. This increased risk of fire damage to residents’ homes has increased economic inequality in Los Angeles County, as wealth significantly enhances one’s possible response to wildfires. As early as 2005, wealthy individuals have been able to sign up for Private Fire Protection Services, typically at a high cost. While most individuals affected by fires were forced to flee their homes, wealthy individuals were able to wait out wildfires in luxury hotels while private firefighters worked to defend their properties from impending flames. This disparity was evident during the most recent Thomas Fire in 2017, when farm-owners left their properties to seek safety and returned to find their crops — and ultimately their livelihoods — destroyed. At the same time, many wealthy celebrities returned to their mansions on the beach, next-door to the farmers, with their properties untouched by the flames. Some climate activists have begun to refer to this emerging phenomenon as an impending “disaster apartheid.” As climate change continues to exacerbate wildfires and natural disasters become more frequent, there is a worry that a divide will form between “common” middle- and lower-class individuals and the wealthy elite. Los Angeles County will need to work especially hard in the near future to ensure that wealth does not drive a further wedge between its residents in the face of climate change. Further reading:California's New Normal: How the Climate Crisis is Fueling Wildfires and Changing Life in the Golden State. CNN California Wildfire Preparedness. States At Risk Why Does California Have So Many Wildfires? The New York Times Article Author: Benny Weisman, Georgetown University
Article Editor: Maddie Bowen, Georgetown University FUTURE: rising temperatures, increased precipitation, and hardier crops in Marion County, Indiana4/30/2018 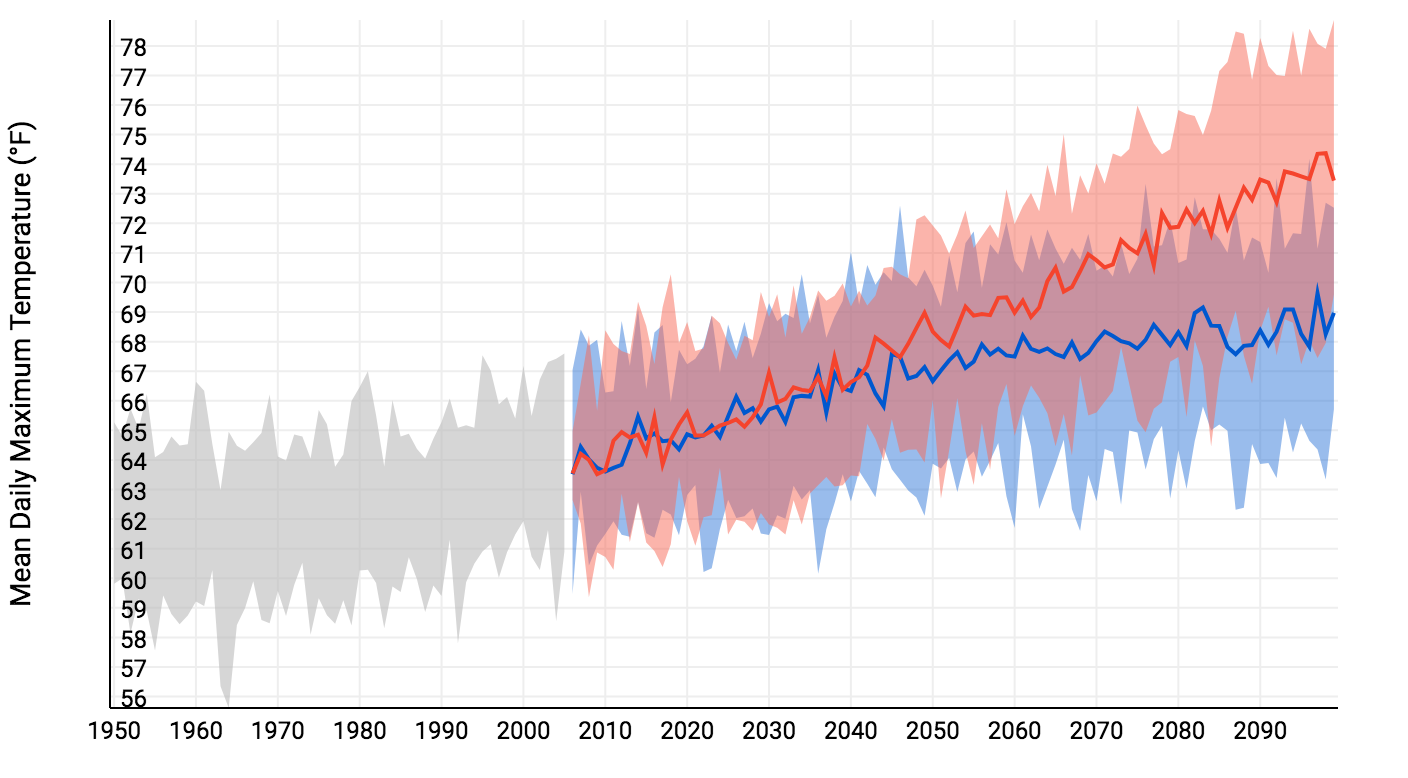 Mean daily maximum temperature for Marion County in the past (grey) and the projected future under high (red) and low (blue) emissions scenarios. Source: NOAA Climate Explorer. Climate changes and the local environment:As the amount of carbon dioxide in the atmosphere continues to increase due to human emissions, average annual temperatures in Marion County, Indiana are expected to rise from an annual average of about 63.5°F in 2007 to an average of 69°F by 2100 under “low emission” predictions, or an average of 73.5°F under “high emission” predictions. Low emission conditions are estimated by assuming that we will at least moderately decrease our emissions in the near future, while high emission conditions assume that we will do nothing to change our current behavior. Without immediate action to reduce emissions, we can expect to have almost twenty times as many extreme heat days in Marion County. Extreme heat days are days when the highest temperatures rise above 95°F. Likewise, Marion County is expected to experience three to four times as many high heat nights, defined by temperatures 68°F or above, in the coming century under low and high emission scenarios respectively. Another consequence of climate change that Marion County will face in the coming years is a likely increase in rainfall. Average annual precipitation has been increasing since 1895 in Indiana, and is expected to continue to increase in the future, possibly by 6-8% within the next half century. Most of this rain is expected in the winter and spring, leaving the summer and fall months possibly drier than they are now. With increased precipitation, we also expect to see heavy downpours more often followed by more frequent flooding. 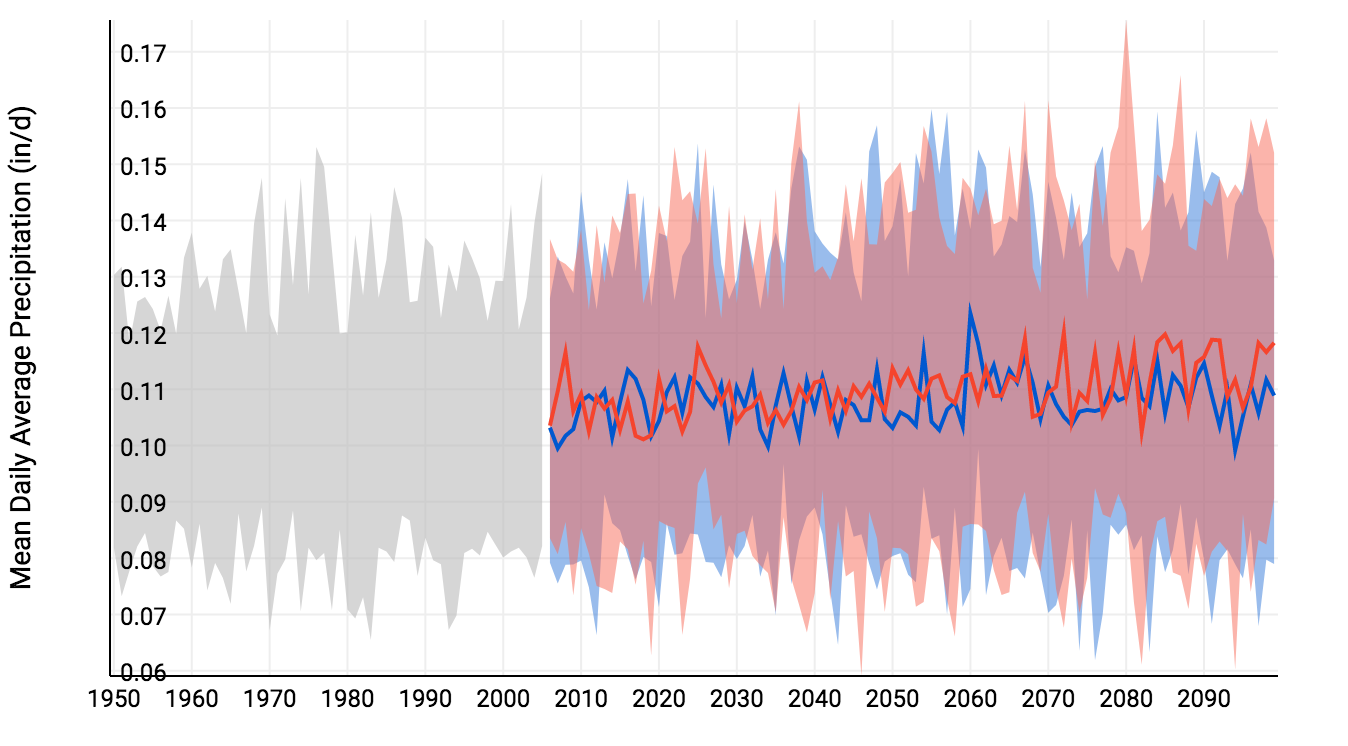 Mean daily average precipitation for Marion County in the past (grey) and the projected future under high (red) and low (blue) emissions scenarios. Source: NOAA Climate Explorer. How we know:The projections of future climate change presented in this article come mainly from the Indiana Climate Change Impacts Assessment compiled by Purdue University and the National Oceanic and Atmospheric Administration’s (NOAA) Climate Explorer tool. Both of these tools rely on temperature and precipitation data gathered at weather stations on the ground around the county and state. These historical values are then compared to predictions for the future compiled by the United Nations’ Intergovernmental Panel on Climate Change (IPCC). The IPCC creates future predictions with advanced computer models that evaluate the climate under different emissions scenarios. Human consequences:Rising temperature and changes in rain patterns will likely have serious consequences for the health of people in Marion County. Scientists expect higher rates of dehydration, heat stroke, and death. Extreme heat can worsen pre-existing conditions, such as heart disease and diabetes, especially among children and the elderly. The number of deaths that can be linked to temperature extremes is expected to rise from 33 in 1990 to between 43 and 71 per year by 2050. As temperatures rise in Marion County, air quality may also decline. Ozone particles stay near the ground in hot weather, triggering asthma attacks and exacerbating high blood pressure. Since cold winters currently control populations of mosquitoes and ticks, warming trends could well promote a sharp increase in the number of both pests, which could in turn allow the disease they carry to infect more people. It is likely that the emissions cuts that would reduce global warming would save more lives in Indiana than in most other states. The growing season in Marion County has already lengthened significantly. By the 2050s, it is expected to lengthen by at least thirty days under high emission scenarios. The longer growing season will likely increase crop productivity in Marion County, though not as much as one might expect. The increasing number of high heat days will likely damage some crops, and the increase in precipitation during winter and spring, together with the rise in extreme precipitation events, should increasingly wash fertilizer and nutrients from the soil into nearby watersheds. Nevertheless, Indiana is likely to remain the top producer of corn and soybeans. Marion County will therefore growing increasingly uncomfortable and unhealthy for many of its residents, yet a key sector of its economy - agricultural production - may in fact benefit from at least modest warming. These benefits will likely decline sharply in high emissions scenarios, and it is therefore in the interest of Marion County residents to contribute to a lower-carbon future. Further reading:2014 EPA Clean Power Plan. EPA. Impacts of Climate Change for the State of Indiana. EPA. Indiana’s Past and Future Climate. Purdue University. Article author: Eve Kelly, Georgetown University
Article editor: Dr. Dagomar Degroot, Georgetown University FUTURE: rising sea levels, strengthening storms, and changing precipitation in Monmouth County3/23/2018 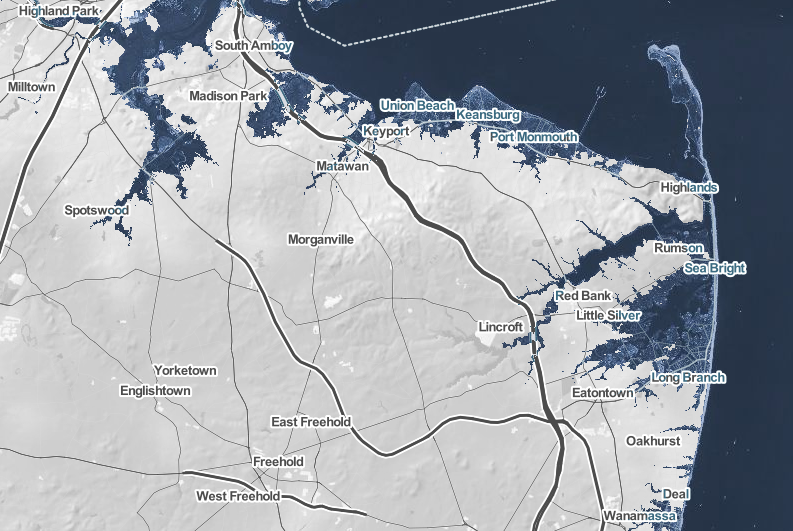 Projected sea level increases in Monmouth County given 2° C warming, relative to 20th-century averages. Climate changes and the local environment: Monmouth County spans across the lower portion of the neck of New Jersey, extending to the eastern coastline. A 2011 report from Columbia University identifies sea level, storm surge, and precipitation, all of which are expected to increase within the next century, as primary climate change associated concerns for New Jersey’s coastal areas. High concentrations of long-lived greenhouse gases like carbon dioxide and methane in the atmosphere are causing warmer global temperatures. The result is thermal expansion and melting glacier mass that contribute to an increase in sea levels. Sea levels along the Jersey Shore have already risen 0.36 meters in the last century, and that number will increase sixfold to 2 meters by 2100. Moreover, a 2ºC increase in global temperatures will further this sea level increase to 4.7 meters. The renown beaches of the area will cease to exist as a result of sea level rise, negatively affecting marine life. Resulting higher flood levels will also disrupt wetlands and terrestrial life further in the county as they become open water. Plant composition and communities will, in fact, change, a disruption that will resonate with other organisms. Warming global temperatures will also increase the amount of precipitation the county will experience. Early snowmelt will make for wetter winter and spring months though this will actually intensify summer dryness. The warmer ocean surface temperatures are also likely to increase both the frequency and intensity of hurricanes that hit the area. Hurricanes increase both in frequency and in strength with warming sea surface temperature (SST). Projections predict more hurricanes like 2011’s Irene and 2012’s Sandy, both of which disrupted activity in Monmouth County, mostly due to flooding. 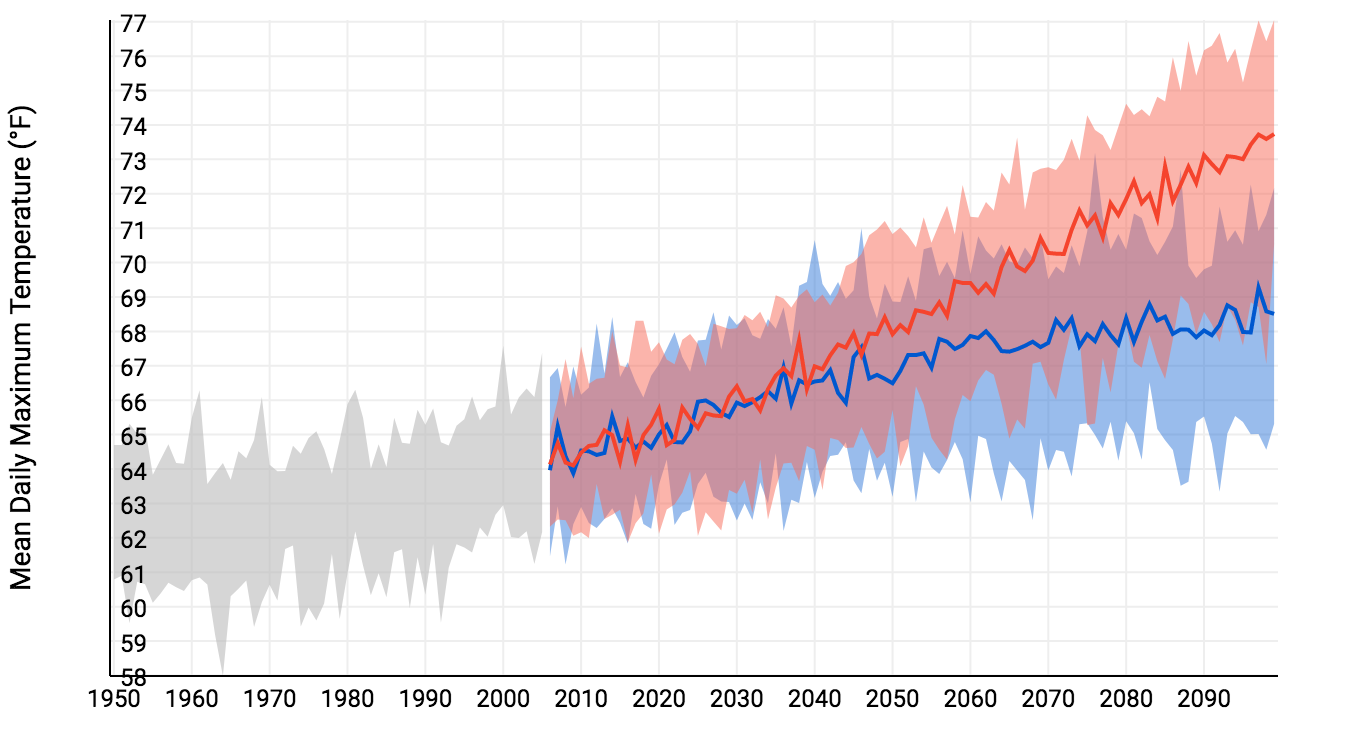 Mean daily maximum temperature for Monmouth County in the past (grey) and the projected future under high (red) and low (blue) emissions scenarios. Source: NOAA Climate Explorer. How we know: These projections primarily rely on two tools that are freely accessible online: the National Oceanic and Atmospheric Administration (NOAA) Climate Explorer app, and the Climate Central Surging Seas, Mapping Choices app. The Climate Explorer tool uses weather information recorded by meteorological instruments at weather stations to reconstruct past climate changes. It uses supercomputer simulations of future climate changes under both high and low emissions scenarios. The Surging Seas tool combines historic flood statistics and local sea level trends with global scenarios of sea level increases, which were compiled in the 2014 U.S. National Climate Assessment. 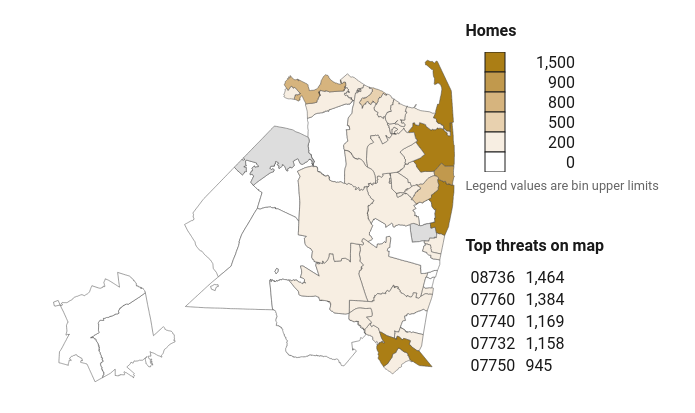 Homes less than five feet below sea level in Monmouth County, organized by zip code. Source: Climate Central. Human consequences: The continuing increase in global temperatures will impact important industries, local businesses, and homes significantly as sea levels rise due to warming oceans and melting glacier mass. Beach erosion will contribute to much of the blow the region receives since they serve as a great source of revenue for the area by attracting tourists and allowing the growth of local businesses. The county’s coastal lakes are also integral in its commercial and recreational activities, and significant changes in the waters present an alarming concern for Monmouth county inhabitants. Notably, the shellfish industry that makes up 66% of New Jersey’s commercial fishing revenue is at risk as the population of such organism decrease as a result of ocean acidification. Similarly, homes along the coast will be destroyed due to greater storm surges. Over 9,000 homes ($5 billion in property value) housing 18,000 people will be at a 97% risk if Monmouth County sea levels reach the projected 4.7 meters. Thus, the livelihood of the county’s coastal inhabitants is in danger due to anthropogenic global warming leading to rising sea levels and flooding. The impacts of these climate change related changes will be especially hard-felt among low-income communities who have a high vulnerability. Moreover, hazardous waste sites that in areas predicted to experience high level of flooding present an additional worry for Monmouth County as flood waters can release harmful materials. While 2100 and the projected sea level and flooding changes seem far away, the threat they pose calls for immediate action. New Jersey has taken several mitigation measures to increase the resilience of its inhabitants. However, these efforts only confer higher taxes on the population in order to push forward rebuilding initiatives. Further reading: Article author: Armelle Déjoie, Georgetown University
Article editor: Dr. Dagomar Degroot, Georgetown University 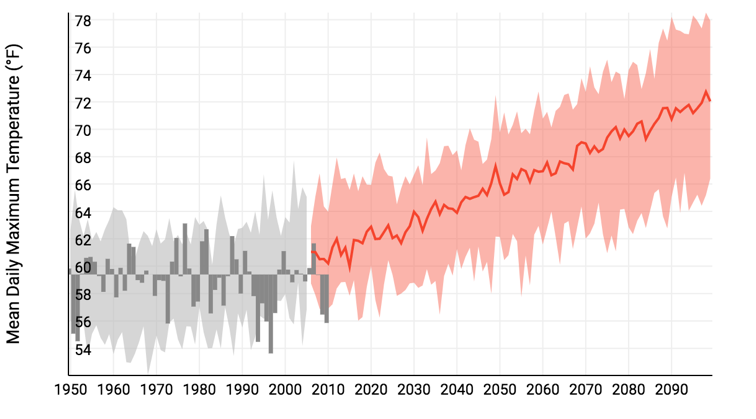 Predicted Mean Daily Maximum Temperatures (˚F) for Buffalo County under a High Emissions Scenario developed by NOAA’s Climate Explorer. Climate changes and the local environment: As the concentration of greenhouse gases increases, temperatures are expected to rise across the United States. Under a high emissions scenario, which occurs if greenhouse gas emissions continue to increase, Buffalo County could see an increase in mean daily maximum temperature from 61˚F to 72˚F by 2100. The average number of days with a minimum temperature below 32 ˚F between 1950 and 2004 was 168 days. This figure is projected to decrease to approximately 110 days by 2100. On the other hand, the number days with a maximum temperature above 95 ˚F will increase from 20 (1950 to 2004 average) to 70 days by 2100. This is significant as this represents an approximately 250% change in days with high heat. It should be noted that the specific figures for the predicted temperature changes are based on the median predicted value from all projections under the high emissions scenario. As the temperature increases, the amount of precipitation is also expected to rise by up to 35 percent, particularly in the spring, compared to the 1960-1970 average by 2080 under a high emissions scenario. However, a large portion of this increase will be accounted for by heavy downpours and more intense storms because as the air warms it is able to hold and then consequently release more water vapor. Because of this, Buffalo County will see an increase in both the risk and severity of summertime drought. The state of South Dakota is projected to see a 75% increase in its summer drought threat index. Additionally, the soil is expected to become drier as the warmer temperatures increase the rate of evaporation and water use by plants. Increased precipitation will only partially offset this because with a higher number of heavy precipitation events the ground will absorb less water and more will run off. The runoff, especially into the Missouri River, which borders Buffalo County, will increase the risk of inland flooding.  Predicted Days with a Maximum Daily Temperature Above 95 ˚F for Buffalo County under a High Emissions Scenario developed by NOAA’s Climate Explorer. How we know: The projections for temperature and precipitation come from the publically available US Climate Resilience Toolkit and Climate Explorer developed by the National Oceanic and Atmospheric Administration (NOAA). Based on historical weather data collected from weather stations in Buffalo County and surrounding areas, it computes models of future precipitation and temperatures under both high and low emission scenarios. Information about the drought and inland flooding risk comes from States at Risk’s Report Card for South Dakota developed by analysts at Climate Central and ICF International. The report assesses how much a state is threatened by and prepared for future extreme heat, drought, wildfires, inland flooding, and coastal flooding. Information about predicted changes in the soil come from a 2016 Environmental Protection Agency report “What Climate Change Means for South Dakota.” Human consequences: Although the predicted climate changes are less severe in Buffalo County than in other parts of the United States, their impacts are exacerbated by the fact that this county is the second poorest in the United States (2017) and that its residents are part of one of the most marginalized groups in the United States. The majority of Buffalo County is part of the Crow Creek Indian Reservation inhabited by the Crow Creek Sioux Tribe. Of the 2,038 residents, 74.9% are Native American and 18.5 % are white. With the lowest median per capita income in the United States and with more than 70% of the residents unemployed, roughly 50 % of the population lives under the federal poverty line. Many homes in this county lack indoor plumbing and kitchens. Families struggle to pay their electric and heating bills. Increased inland flooding especially for those living near the Missouri River and the associated property damages will present an increased economic burden in the future. As the number of days with freezing temperature decrease, people will need to heat their homes for less days a year relieving some financial strain. The number of days with extreme heat will increase, but most families cannot afford air conditioning. High heat will have detrimental health effects on the elderly, young children, and people with pre-existing conditions, such as asthma. The changes in temperature, precipitation, and soil moisture will also impact agriculture in this county. Shorter, more mild winters and warmer summers may extend the growing season, but will also increase the abundance of pests and weeds. However, the drier soil and increased risk of droughts threaten crop yield. Agriculture is the second most common form of employment here, and therefore, changes threaten to make a poor population even poorer. Most importantly, the predicted threats will impact the religion and cultural of the population living here. The Sioux tribes have a deep spiritual connection to the land, water, and animals. In response to the projected increase in temperatures and precipitation, wildlife will shift their ranges and migration patterns and will face habitat loss and heightened mortality. Many traditional foods gathered from the grasslands, including plants, roots, fruits, and mushrooms, will experience a change in their timing and abundance. These changes threaten the deep relationship the residents of this county feel with the environment around them. Climate change will not only continue the cycle of poverty in Buffalo county but will also impact their traditions. Further reading: Climate Change Perspectives from Indian Country. The Hill What Climate Change Means for South Dakota. EPA Article author: Anna Braendle, Georgetown University
Article editor: Dr. Dagomar Degroot, Georgetown University |
 RSS Feed