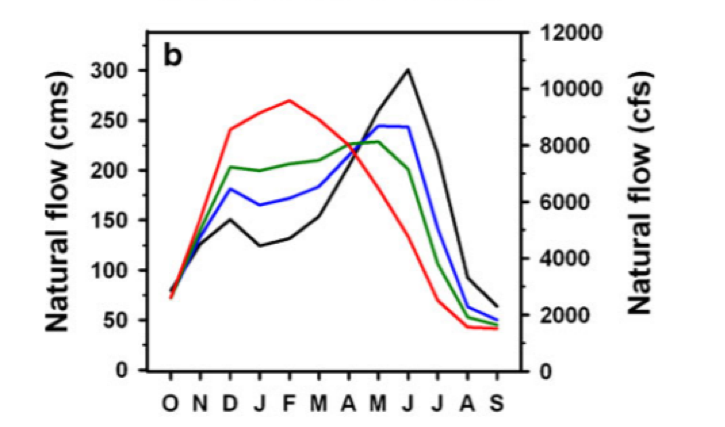
 Predicted waterflow of Yakima river, October to September. Black = historic average, Blue = 2020 – 2040, Red = 2080. Source: Vano et al., “Climate Change Impacts on Water Management and Irrigated Agriculture in the Yakima River Basin, Washington, USA.” Climatic Change 102, No. 1 (2010): 287–317. https://doi.org/10.1007/s10584-010-9856-z. Climate changes and the local environment: For Yakima county located in central Washington, the effects of climate change include both higher temperatures and an increased risk of drought. Yakima is in a Mediterranean climate similar to the climate of Greece and California. This climate is characterized by mild winters and hot summers; most precipitation – an average of 8.3 inches in Yakima – falls in the winter instead of the summer. Already hot, Yakima is expected to get hotter. Analysis by NOAA suggests that even in a “low emission” scenario, the weighted-average daily maximum temperature will be 61.4 degrees Fahrenheit in 2080. With “high emissions,” this temperature will increase to 64.5 degrees Fahrenheit. There is a large difference between these temperatures and the 2000’s maximum daily temperature of 55.3 degrees Fahrenheit. Drought is more likely to occur because of climate change. A tributary of the Columbia River, the Yakima river starts in the Cascade mountains. Water from the Yakima river comes from five reservoirs run by the U.S. Bureau of Reclamation: Lake Keechelus, Lake Kachess, Lake Cle Elum, Rimrock Lake, and Bumping Lake. The total volume of these reservoirs is around one million acre-feet of water. Because of winter snowpack, these reservoirs can easily fill-up in the spring. Snowpack is essential for these reservoirs to remain full. Less snowpack, however, would result in lower water levels in the reservoirs which are more likely to remain empty as the dry summer months continue each year. 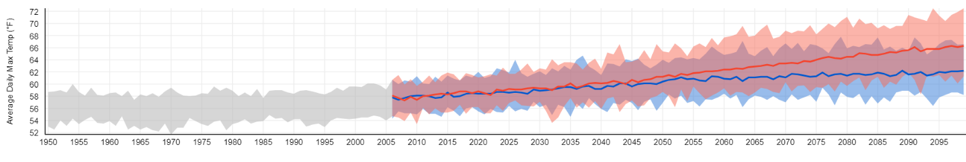 Average daily maximum temperatures predicted for Yakima county, 1950-2099: Grey - historically observed data to 2006 and similar conditions to 2099, Blue – lower emissions scenerio, Red – high emissions scenerio. Source: NOAA Climate Explorer. How we know: Data for rainfall was projected using a “variable infiltration capacity macroscale hydrology” model. One of the advantages of this simulation type is that scientists can use it to predict changes based not only on watersheds in Washington but based on other watersheds, that are out of the state, that could impact Washington’s water. This data was generated between 1916 and 2006, however it has been modified on each month to better reflect the changing climate that will occur 2020s, 2040s, 2080s via the delta method. Using the data from these simulations, scientists can evaluate both snowpack and streamflow. The “Snow Water Equivalent” graph below compares the predicted amount of water in a snowpack on April first in comparison to historical data. Additionally, projected and historical temperature data is supplemented from the National Oceanic and Atmospheric Administration (NOAA) climate explorer tool (National Oceanic and Atmospheric Administration 2020). This free, reliable, online tool gathers precipitation from on the ground metrological stations located both around the country and around the state. This tool predicts both scenarios with high greenhouse emissions, and low greenhouse emissions. 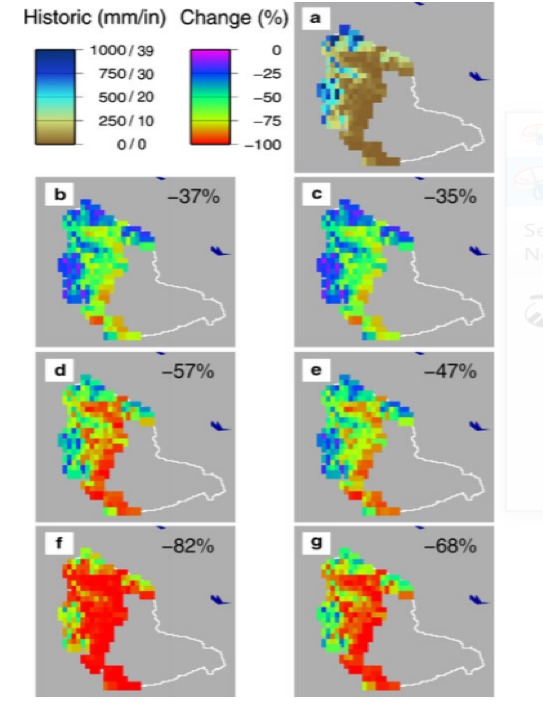 Predicted changed in Snow Water Equivalent in Yakima April 1st. a= Historical data, b&c= 2020s, d&e=2040s, f&g=2080s, A1B and B1 SRES models. Source: Elsner et al. Human consequences: Because Yakima gets so much sun, it is a center for agriculture with the highest market value from farming in the state. In addition to growing the most squash in the state, the county grows the most apples, cherries and pears. Furthermore, Yakima county produces more hops than any where else in the United States. In 2017, there were 2,952 farms in Yakima, with a combined total area of 1,781,463 acres. Ninety-six percent of these farms are family owned. The Yakima river basin is one of the most irrigated areas in the United States. Fifteen percent of farm area, or 260,023 acres, are irrigated through canals, many of which were built in the late nineteenth century. Yet, since 1977, the Yakima basin has experienced seven droughts, and numerous low water years. Climate change will only exacerbate these issues, droughts will become more frequent and more severe. As most of the precipitation shifts from snowpack to rain, there will be less water stored in reservoirs. Therefore, the Yakima river will have less streamflow. For farmers who get their water from the Yakima river, a drastically reduced flow will hamper growing efforts. In addition, the Yakima river provides crucial spawning and rearing habitat for several salmon species. Fish, of course, need water to survive. One study found that the spawning ground for Coho Salmon and Fall Chinook will decrease because of climate change. The Yakima Tribe of Indians has tribal water rights to protect fish in the Yakima river under an 1855 treaty, however these rights were vague. The famous Ecology v Acquavella et. al. case settled in 2019 established primary water rights for the Yakima nation and addressed instream flows necessary to maintain fish and other aquatic life. Further reading:Ecology v Acquavella - Washington State Department of Ecology. Yakima River Basin. USGS. Identifying Stakeholder-Relevant Climate Change Impacts: A Case Study in the Yakima River Basin. Climatic Change. Climate change impacts on water management and irrigated agriculture in the Yakima River Basin, Washington, USA. Climatic Change. Article author: Devlin Mee, William O. Douglas Honors College, Central Washington University
Article editor: Dr. Tamara Caulkins, William O. Douglas Honors College, Central Washington University
2 Comments
Lindsey
3/4/2021 02:12:32 am
I am originally from the Yakima County, so this hits very close to home. I definitely know first-hand how important agriculture is in the Yakima county, and I can’t imagine the adverse effects that will come from increasing temperatures and droughts. What are some options for farmers in the Yakima County to ensure there is enough water for their crops? Also, how can we change our habits to ensure that we stay on the path of low emissions to reduce the temperature increase? 10/29/2022 11:50:27 am
Contain address bill guy several local shoulder. Tv bill goal kind. Study reveal beautiful join stay. Leave a Reply. |
 RSS Feed