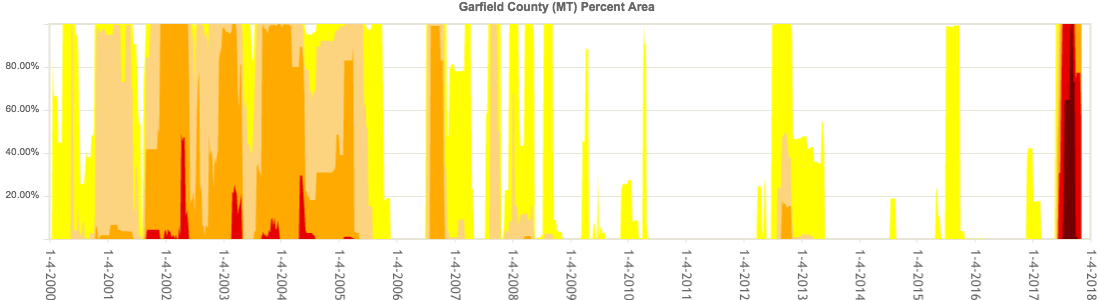
 Drought severity in Garfield County from 2000 until 2018, showing the drought of 2017. Darker colors represent worse droughts; higher values mean more of the county was in drought. Source: United States Drought Monitor. Climate changes and the local environment:Over the past century, average annual temperatures have soared across Montana, rising by almost 2° C (3° F) relative to twentieth-century averages. Warming has shortened winters, and earlier thawing has prevented snow from accumulating. Hotter spring, summer, and fall temperatures have also increased the rate of evaporation across Montana. Average annual precipitation in Montana has increased modestly. However, rainfall has only increased in the early spring and late fall, and precipitation in the summer has actually become more scarce. The summer dry season is therefore drier and longer than it once was. Extreme droughts are now much more likely to occur than they once were. Together, these changes have created ideal conditions for wildfires in heavily forested but sparsely populated Garfield County, Montana. In the summer of 2017, no fewer than 21 wildfires broke out in Montana during a particularly severe, long-lasting drought. Together, the wildfires consumed nearly 1.3 million acres of forest, and two fires alone each burned across over 100,000 acres. National data suggests that climate change, not shifting forest management practices, were responsible for the 2017 wildfires in Garfield county. Beginning in the 1980s, large wildfires across the United States suddenly grew more common, and lasted longer, especially in regions lightly touched by forest management practices. Almost everywhere, rising spring and summer temperatures, and an earlier spring snowmelt, were largely to blame. By burning through old trees and brush, wildfires can bring new life to a forest, making way for diverse plant species and creating new habitats for animals. Yet the dramatic increase in the frequency, scale, and length of wildfires in Montana has interfered with the ability of forests to recover. 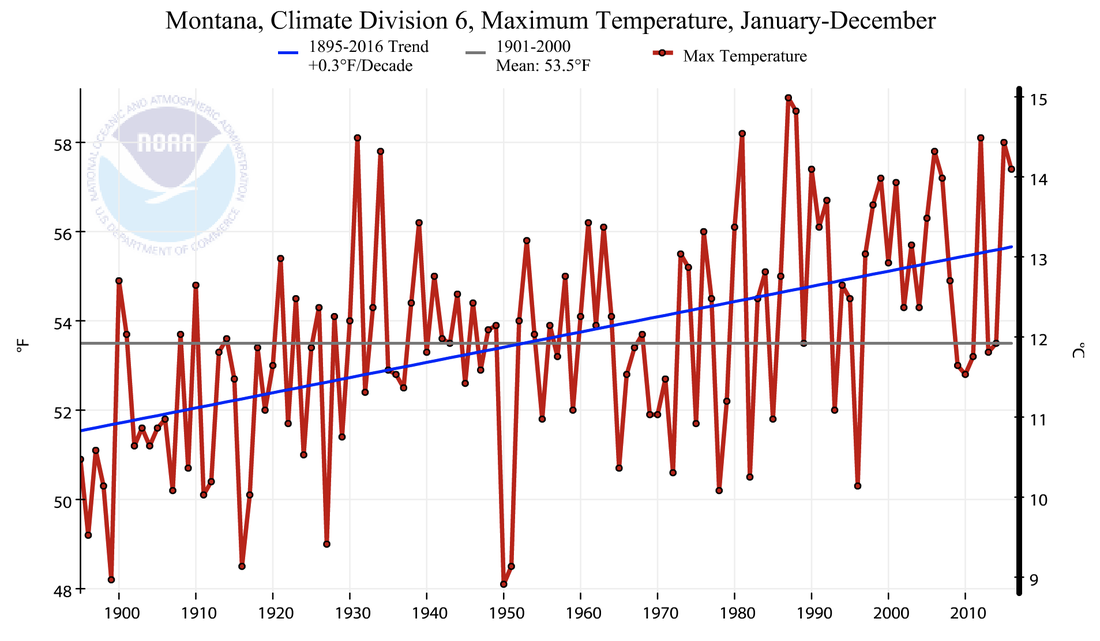 Average daily maximum air temperature in northeastern Montana, 1895-2017. Source: NOAA Climate at a Glance. How we know:These reconstructions are largely based on reliable, easy to use tools that are freely accessible online: the National Oceanic and Atmospheric Administration (NOAA) State Annual and Seasonal Time Series, the NOAA Climate at a Glance app, the National Drought Mitigation Center's United States Drought Monitor. NOAA's State Annual and Seasonal Time Series and Climate at a Glance tools use data collected at weather stations and stored in NOAA's U.S. Climate Divisions database. The Drought Monitor compiles weekly maps of drought conditions across the United States, and combines climate, soil, and water data with reports from 350 experts across the country. These reconstructions also draw on visualizations provided by the National Interagency Fire Center, which has created a tool that predicts the potential of new wildfires based on previous weather conditions. They also rely on an important 2006 study in the journal Science, which finds clear links between warming and wildfires. 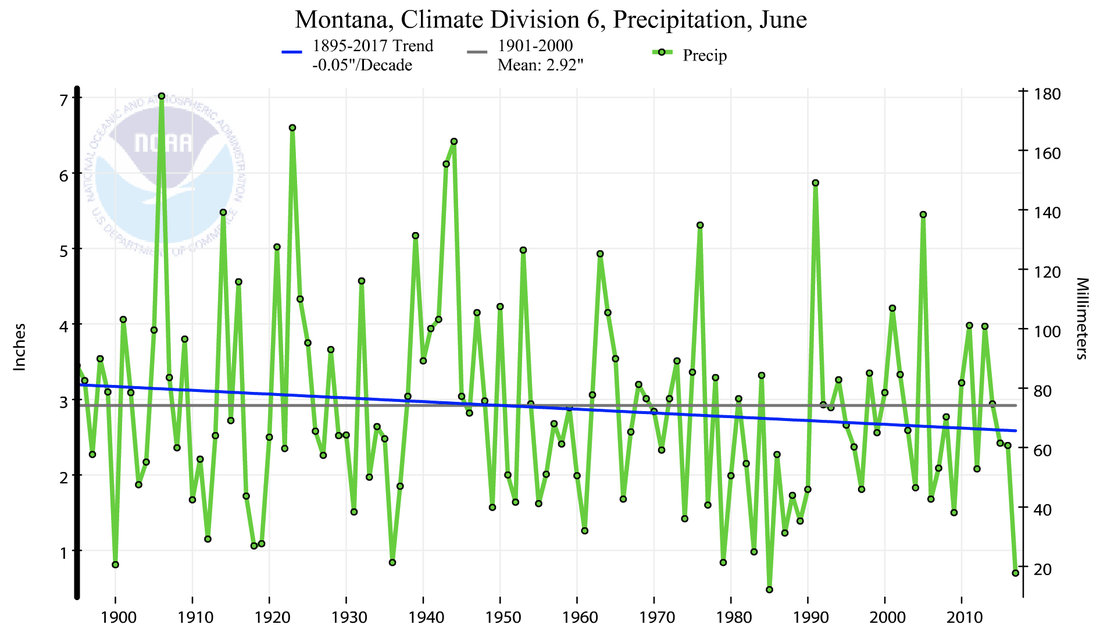 Average June precipitation in northeastern Montana, 1895-2017. Source: NOAA Climate at a Glance. Human consequences:In recent decades, the environment of Garfield County has grown more dangerous for its human residents. In 2017, the Lodgepole wildfire spread into Garfield County and eventually consumed an area the size of New York City. After billions of dollars were spent to control the fire, and two firefighters lost their lives, the county nevertheless lost over 20 buildings. Meanwhile, drought and wildfires have together undermined cattle ranching, a staple of Montana's economy and culture. Fires not only destroyed grazing land and killed cattle, but also incinerated nearly 2,300 km (1,300 miles) of fencing, and required costly hay imports. Some ranchers have had to sell cattle in huge quantities because there is no more grazing land to support them, and many ranchers will lose "genetics" that have taken years to hone. Young ranchers have seen their businesses ruined before they ever got off the ground. 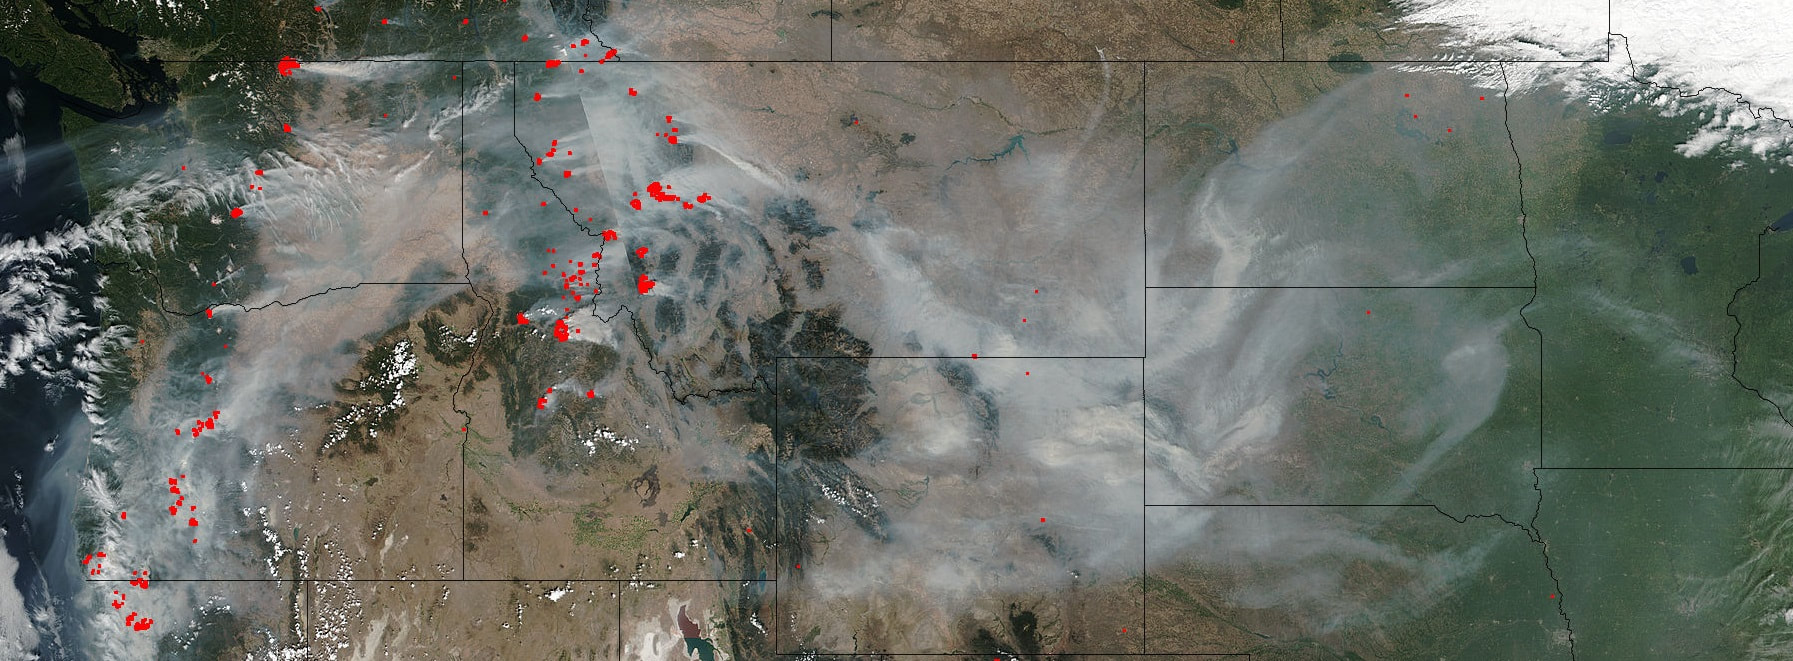 A satellite image of wildfires across the western United States in summer, 2017. Source: NASA The destructiveness of the 2017 wildfires have provoked renewed debate about logging in the forests of Montana. Advocates insist that logging reduces the risk of forest fires and spurs Montana's economy. Skeptics point out that although millions of acres of forest have been cleared of dangerous fire "fuels" - including in Garfield County - wildfires nevertheless burned uncontrollably. Droughts worsened by climate change have overwhelmed local attempts to confront wild fires. Further reading:Long-term Losses of Montana's Fire Season Amount to Much More than Scorched Grass. Billings Gazette Montana Wildfires Reignite Logging Debate. NPR Wildfire Myths: Logging the Forest Won’t Save It. Counter Punch Garfield County Community Wildfire Protection Plan. Walsh Environmental Scientists and Engineers, LLC Article author: Sabine Neschke, Georgetown University
Article editor: Dr. Dagomar Degroot, Georgetown University
0 Comments
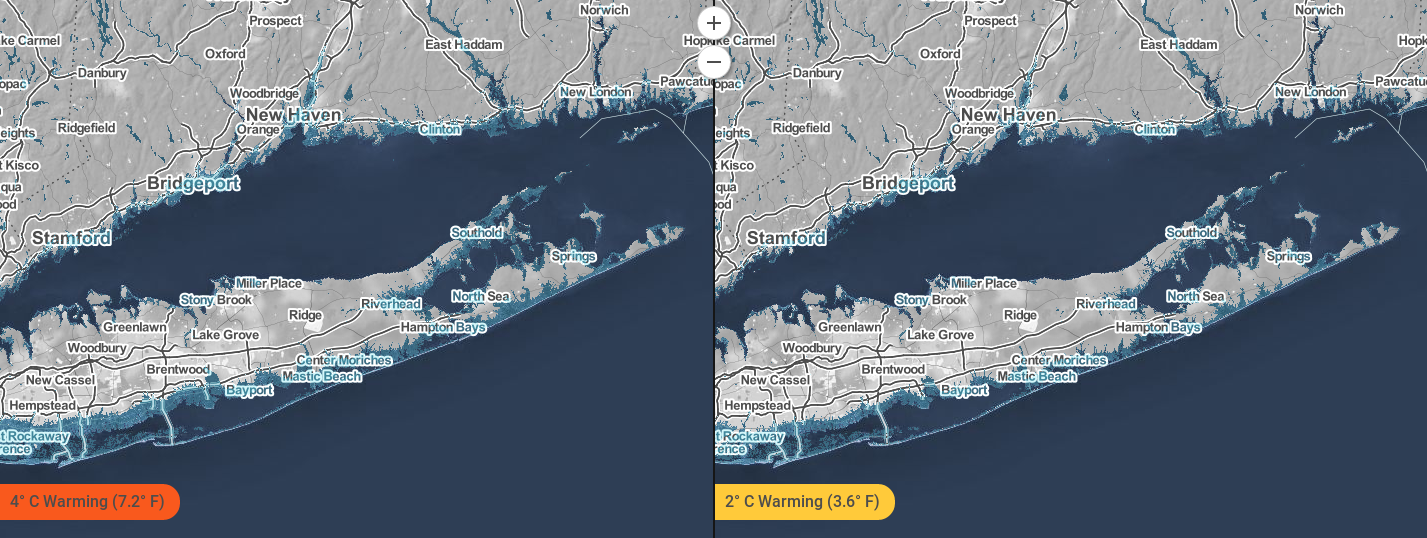 Changes to the Suffolk County coastline under two different emissions scenarios. Source: Climate Central Surging Seas: Mapping Choices. Climate changes and the local environment:As global sea levels rise, regional variations in ocean temperatures, prevailing winds, ocean currents, and the rise or fall of Earth's crust mean that some communities have experienced, and will experience, greater sea level increases than others. Sea levels off Suffolk County, Long Island, for example, are rising at a rate of around 3.23 mm/year, which is up from 2.78 mm/year just one decade ago. New York State is in fact sinking relative to the sea, owing to a combination of human activity and the slow rebound of the landscape following the retreat of the great glaciers that covered the state during the last ice age. Meanwhile, the melting of polar ice sheets and the warming of Earth's oceans mean that seal levels off the state are projected to increase steadily. If emissions of greenhouse gases continue unabated, and average global temperatures rise by around 4° C (roughly 7° F) relative to twentieth-century averages, then the entire southern coast of Long Island, including that of Suffolk County, will eventually be inundated. Montauk, the tip of Suffolk County, will then become its own island, separated from Long Island by a chasm of water. Winters, meanwhile, are expected to grow shorter but wetter, and major storms - such as Superstorm Sandy - are projected to grow more common. Storm surges will likely threaten natural defenses against the sea, including saltwater marshes and dunes, in ways that may permit even more extensive flooding. 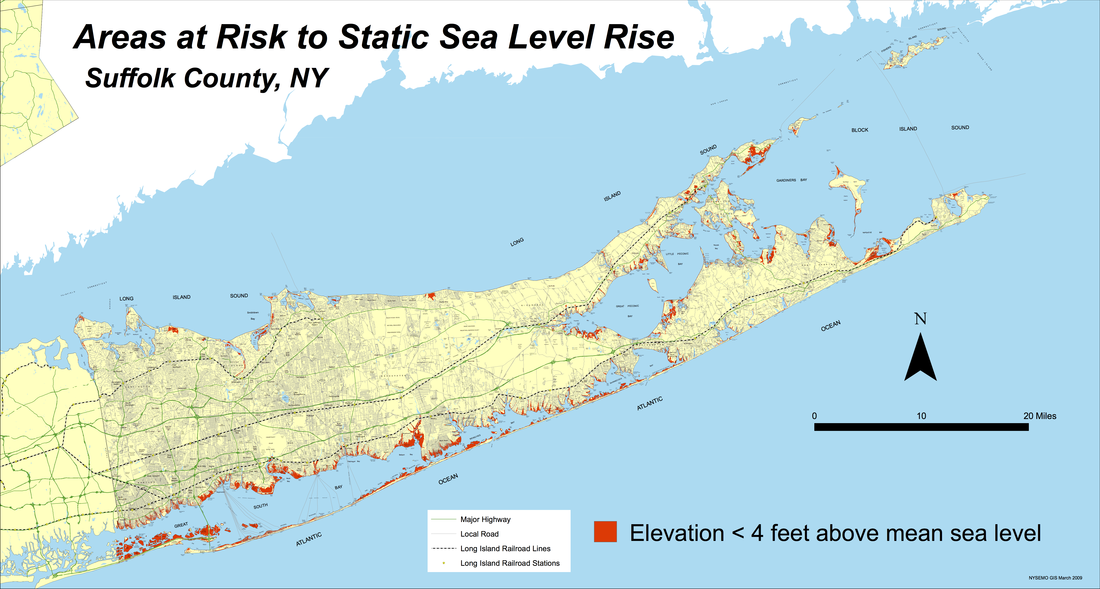 Areas in red are less than four feet above sea level, and are already highly vulnerable to flooding in major storms. Source: Department of Environmental Conservation, New York State. How we know:These projections and reconstructions are largely based on reliable, easy to use tools that are freely accessible online: the National Oceanic and Atmospheric Administration (NOAA) Sea Level Trends app, the NOAA Climate Explorer app, and the Climate Central Surging Seas, Mapping Choices app. The Sea Level Trends tool shows regional mean sea level changes from the twentieth century through today. NOAA collects data for these measurements through the 142 long-term tide stations of the National Water Level Observation Network, which has been measuring sea level for over 150 years. Each regional mean sea level rise or fall is computed using a minimum of 30 years of data to ensure accuracy. The Climate Explorer tool uses weather information recorded by meteorological instruments at weather stations to reconstruct past climate changes. It uses supercomputer simulations of future climate changes under both high and low emissions scenarios. The Surging Seas tool combines historic flood statistics and local sea level trends with global scenarios of sea level increases, which were compiled in the 2014 U.S. National Climate Assessment. These projections also make use of a map designed by the New York State Department of Environmental Conservation, which shows the extent of low-lying coastal areas around Suffolk County. 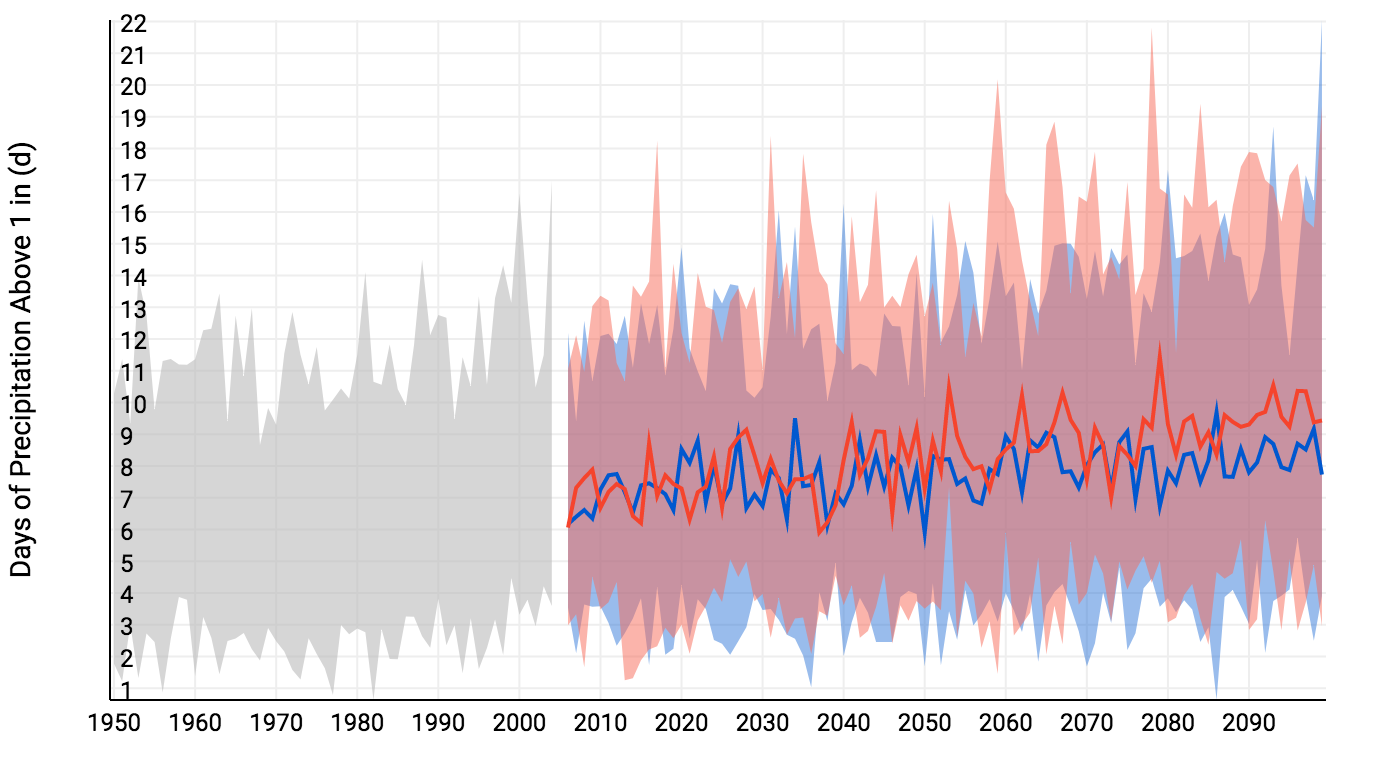 Modeled days of extreme precipitation in Suffolk County, up to 2100. Much of the projected increase involves winter precipitation. Red shows the projection for a future with higher emissions, and blue with lower emissions. Source: NOAA U.S. Climate Resilience Toolkit (Climate Explorer). New York State is the third largest coastal flooding threat in the United States, and in 2008 it was reported that about 13.9 percent of the state's residents live directly on the coast. Many towns in Suffolk, particularly some of those located on the southern border, are precariously close to the sea. Even in scenarios that assume drastic action to curb human-caused greenhouse gas emissions, many of these towns will be underwater. Well before that happens, rising sea levels and intensifying storms will batter coastal infrastructure. Today, warming sea surface temperatures are already undermining the quality of local drinking water, and the health of coastal ecosystems, by creating ideal conditions for toxic bacteria. Wetlands that help filter pollution from water flowing out to sea, meanwhile, are vulnerable to rising sea levels and intensifying storms. Further inland, rising temperatures will encourage the spread of pollen, ragweed, and poison ivy, will creating more favorable conditions for Lyme disease. Suffolk County, in short, is set to become a far less healthy place for its inhabitants and the ecosystems on which they depend. In response, municipal, state, and federal governments have mobilized to shore up flood defenses - such as coastal dunes - while some county residents have elevated their coastal homes and businesses. In the long run, however, coastal areas of the county will either need to be protected using very expensive defenses against the sea, or evacuated to make way for the rising waters. Read more:Climate Change Could Threaten Long Island. The Weather Channel Coastline Population Trends in the United States: 1960 to 2008. US Census Bureau Article author: Isabel Paret, Georgetown University
Article editor: Dr. Dagomar Degroot, Georgetown University 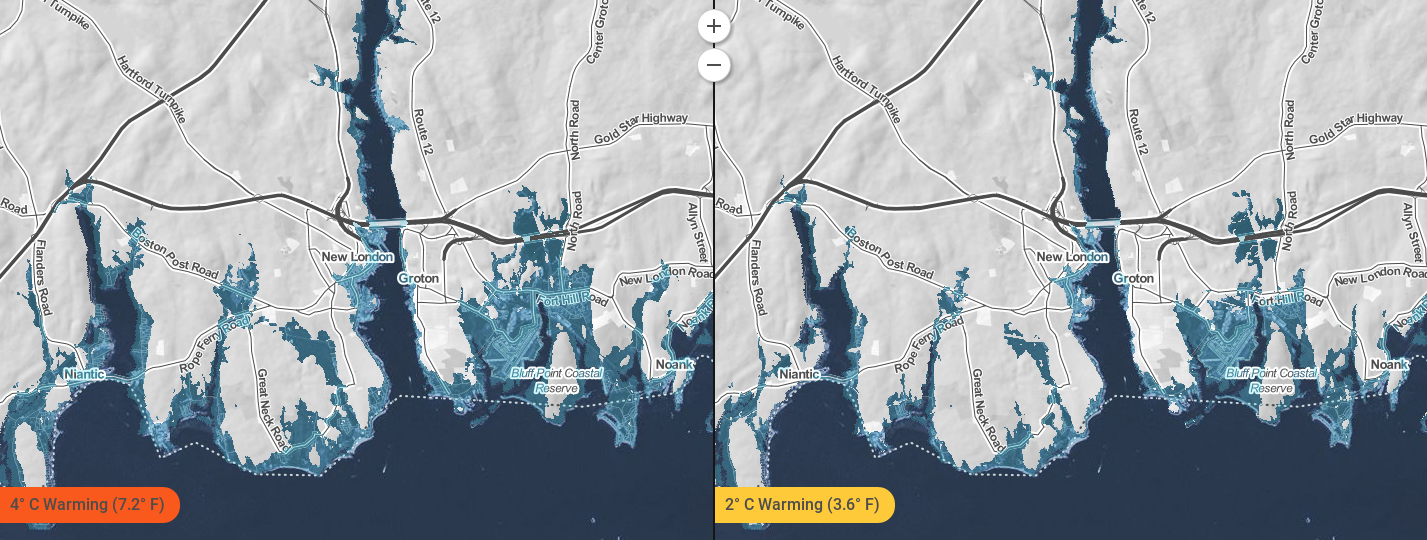 Changes to the New London County coastline under two different emissions scenarios. Source: Climate Central Surging Seas: Mapping Choices. Climate changes and the local environment:Mean global sea levels have risen by at least 17 centimeters (nearly 7 inches) in the twentieth century. Yet regional variations in ocean temperatures, prevailing winds, ocean currents, and the rise or fall of Earth's crust mean some areas have experienced, and will experience, greater sea level increases than others. Off Connecticut, for example, sea levels are today increasing more quickly than the global average. Connecticut is in fact sinking as its crust slowly recovers from the immense weight of glaciers that covered it during the last ice age. Connecticut is sinking by over 0.03 inches per year, even as Earth's ocean rise. Rising sea levels and sinking land will have dire consequences for the environment of New London County in Connecticut. Low-lying coastal lands in and around the county will eventually be inundated, overwhelming natural flood and storm barriers such as beaches and wetlands. That will make the county ever more vulnerable to coastal storms and flooding, which will grow more frequent and severe as Earth's climate warms. In fact, the Connecticut Governor’s report predicts that by 2050, New London County may face a 100-year storm every 56 years. A 100-year storm refers to a storm of such rarity and magnitude that it has only a 0.1 percent chance of happening in New London County in any given year. Meanwhile, precipitation is on the rise in New London County as local temperatures warm. Hotter air holds more water vapor than cold air, so it is no surprise that average annual precipitation is increasing, while extreme precipitation events - such as torrential rains - are growing more frequent. Both trends are expected to accelerate in the future. Stronger storms sweeping in from the sea are therefore projected to bring more coastal floods in the warmer future, while heavier rains lead to more river floods in New London County. 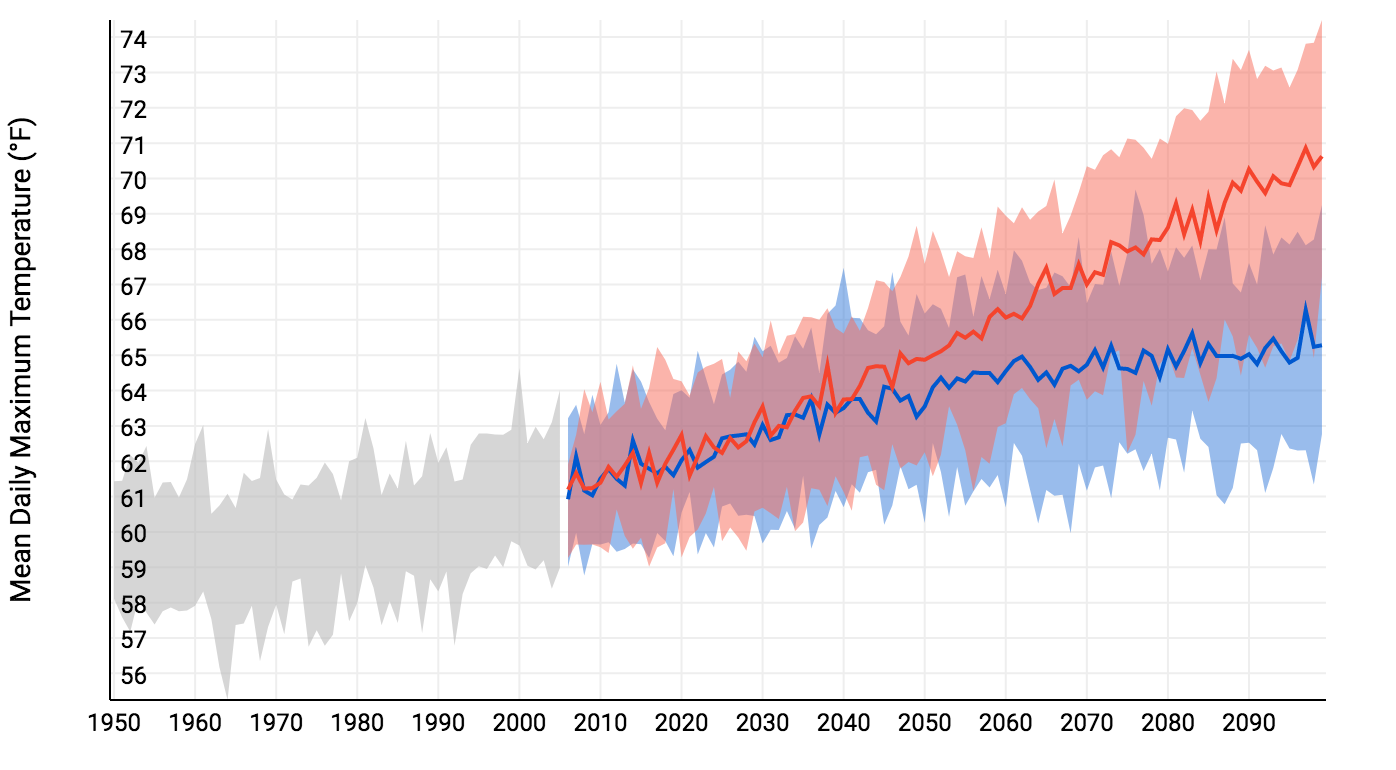 Past and projected changes to the daily high in New London County. Red shows the projection for a future with higher emissions, and blue with lower emissions. Source: NOAA U.S. Climate Resilience Toolkit (Climate Explorer). How we know:These predictions are based on four easy to use tools that are freely accessible online: National Oceanic and Atmospheric Administration (NOAA) Sea Level Trends app, the NOAA Climate Explorer app, and the Climate Central Surging Seas, Mapping Choices app, and the Aqueduct Global Flood Analyzer. The Sea Level Trends tool shows regional mean sea level changes from the twentieth century through today. NOAA collects data for these measurements through the 142 long-term tide stations of the National Water Level Observation Network, which has been measuring sea level for over 150 years. Each regional mean sea level rise or fall is computed using a minimum of 30 years of data to ensure accuracy. The Climate Explorer tool uses weather information recorded by meteorological instruments at weather stations to reconstruct past climate changes. It uses supercomputer simulations of future climate changes under both high and low emissions scenarios. The Surging Seas tool combines historic flood statistics and local sea level trends with global scenarios of sea level increases, which were compiled in the 2014 U.S. National Climate Assessment. The Global Flood Analyzer estimates the vulnerability of regions to flooding, providing figures for the cost of flood damage and number of people affected. 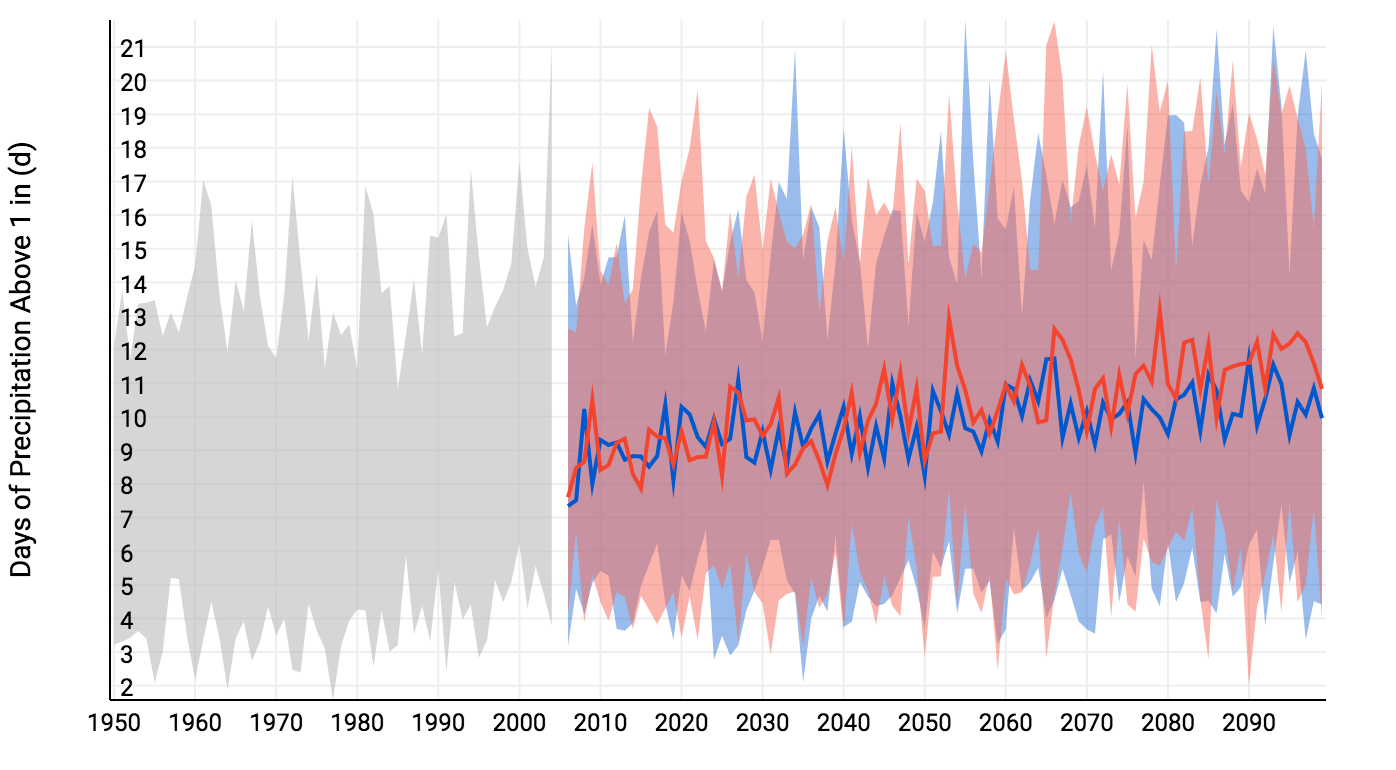 Past and projected days, per year, with more than one inch of precipitation in New London County. Red shows the projection for a future with higher emissions, and blue with lower emissions. Source: NOAA U.S. Climate Resilience Toolkit (Climate Explorer). Human consequences:New London County is already coping with climate change. In 2010, New London endured a 100-year flood after heavy rains caused rivers to spill their banks and ground water to overflow sewage systems. The Federal Emergency Management Agency (FEMA) estimated that the flood cost the county $5.3 million in losses and damages. Precipitation trends will make such floods more common. In New London County, a total of 4,306 residents currently live in homes that are less than 6 feet above sea level. By 2030, there is a 67% chance that flood with waters 6 or more feet above sea level will occur, which would put all these lives and homes at risk. Increased intensity and frequency of both coastal storms and flooding is hugely detrimental to infrastructure and business in New London County. In particular, the Naval Submarine base and the General Dynamics Electric Boat Corporation submarine construction yard, which is the primary builder of submarines for the U.S. Navy, are at risk from sea level rise, storms, and flooding. These establishments are essential to the county’s economy and to national security. Re-engineering of the base and the submarine construction yard may be necessary in order to keep them functional in the face of rising sea levels, yet this would be staggeringly expensive. The consequences of climate change and global warming have already harmed many of coastal communities in New London County. Under all future emissions scenarios, even very optimistic ones, further damage is all but inevitable. Further reading:Climate Change Primer - Sea Level Rise and Coastal Storms. State of Connecticut Climate Suggests Floods will Probably Happen Again. The Day Article author: Georgia Brainard, Georgetown University
Article editor: Dr. Dagomar Degroot, Georgetown University 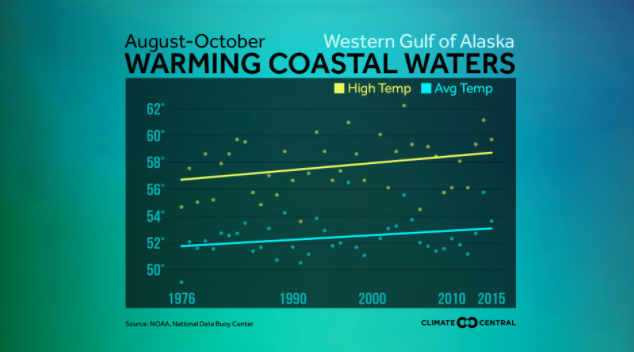 Average and annual high temperatures in the waters of the Western Gulf of Alaska, 1976-2015. Climate changes and the local environment:Between 2013 till early 2017, the east pacific along the west coast of the United States experienced incredibly high temperatures. In 2013, a patch of alarmingly warm water developed along the Gulf of Alaska, due to a force called “The Blob.” The Blob was a patch of warm air that built up when decreased winds failed to distribute and cool the sea surface. In January of 2014, a natural cycle called the Pacific Decadal Oscillation (PDO) shifted to a warm phase and began adding to the pre-existing heating from the Blob. The PDO naturally alternates between periods of warming and periods of cooling along the Gulf of Alaska, and in 2014 it began a warming trend that continued into 2016. However, while the PDO is a natural cycle, it is likely that it has been increasingly impacted by human caused climate changes in the last 30 years. Human actions, such as greenhouse gas emissions, have led to increases in temperature, which intensify the natural warming of the PDO. While they have already begun to have an impact on Sitka and the Gulf of Alaska, these human effects will only continue to magnify the PDO’s effect further in the next few decades, as sea surface temperatures continue to increase. Because of the high temperatures in the Gulf of Alaska, a toxic algae bloom formed along the coast of Sitka and lasted longer than normal. Algae flourishes in hot areas, so the unusually warm trend was perfect for growth. 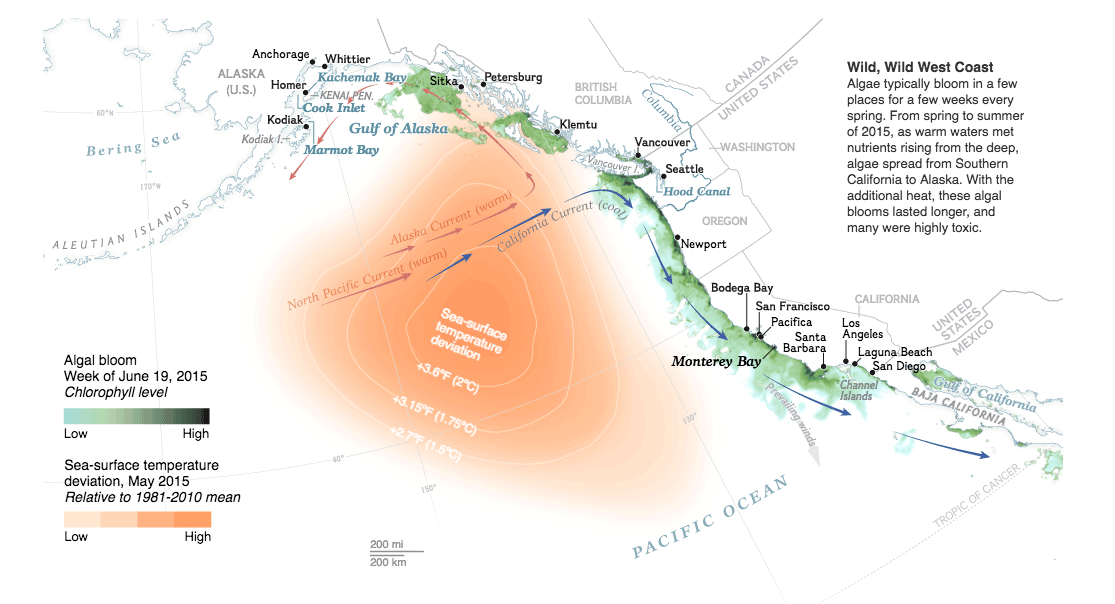 Warm sea surface temperatures and toxic algae off Alaska, 2015. Source: Lauren E. James, NGM Staff; Nick Bond, University of Washington; Raphael Kudela, University of California Santa Cruz. How we know:The warming trends seen in the Gulf of Alaska between 2013 and 2016 can be accessed online through various sources, such as the National Oceanic and Atmospheric Administration (NOAA) Northwest Fisheries Science Center and the NOAA National Data Buoy Center. NOAA’s buoy data has been organized in this article to show the rising temperatures along the United State’s coastal waters. NOAA’s data on sea surface temperature is gathered from satellites observations and from drifting buoys stationed along coasts that collect temperatures at different depths. Data on algal blooms is collected by sampling water along the coast and counting the algae present in the sample. This article from National Geographic shows the trend between the increased temperatures starting in 2013 and algal blooms. Large scale changes in climate such as the PDO can be modeled by combining measurements of sea ice, taken by satellite measurements, with sea surface temperatures overtime. This study from the journal Climate Dynamics uses these two measurements to discuss the likely connection between human caused warming and magnified PDO cycles. Human consequences:The increase in temperature along the coast of Sitka killed zooplankton on a large scale. With zooplankton populations low, animals that rely on plankton for food and others further up the food chain, like starfish, sea birds, whales, and sea otters, experienced large die offs. These trends also impacted the Coho salmon populations, leading to a harvest in 2016 that was below the 10 year average. Impacts of the warming trend in 2015 and 2016 will not be observed for the Chinook salmon until later in 2017, but they are predicted to have a similarly negative impact. In an economy where 1 in 10 jobs are supported by salmon, decreases in Salmon production have major impacts on the community. The large-scale algal bloom also put Sitka’s subsistence harvesters at risk. The toxic algae collect in the body of shellfish as water filters through them. When people harvest and eat infected shellfish, the toxins from the algae can cause symptoms as severe as brain damage or death. The first death in Sitka recorded as a result of poisoned shellfish appeared in 1799 and more have continued to pop up throughout the years. Large-scale algal blooms, like the one in 2015, spread the toxins and put the harvesters of Sitka at risk. Shellfish that is collected on the Sitka shore provide a cheap source of protein that is becoming increasingly vulnerable. While the effects of the Blob and PDO began receding in 2017, they foreshadowed how the ocean will look in a warming world. For the people of Sitka in particular, a warmer ocean could undermine local food sources and employment. Further reading:Paralytic Shellfish Poisoning (PSP) Warning Issued for Southeast Alaska. Sitka Local Foods Network Harmful Algal Blooms—Exacerbated by Warming Ocean Temperatures. U.S. Climate Resilience Toolkit Run Forecasts and Harvest Projections for 2017 Alaska Salmon Fisheries and Review of the 2016 Season. Alaska Department of Fish and Game Article author: Eve Kelly, Georgetown University
Article editor: Dr. Dagomar Degroot, Georgetown University 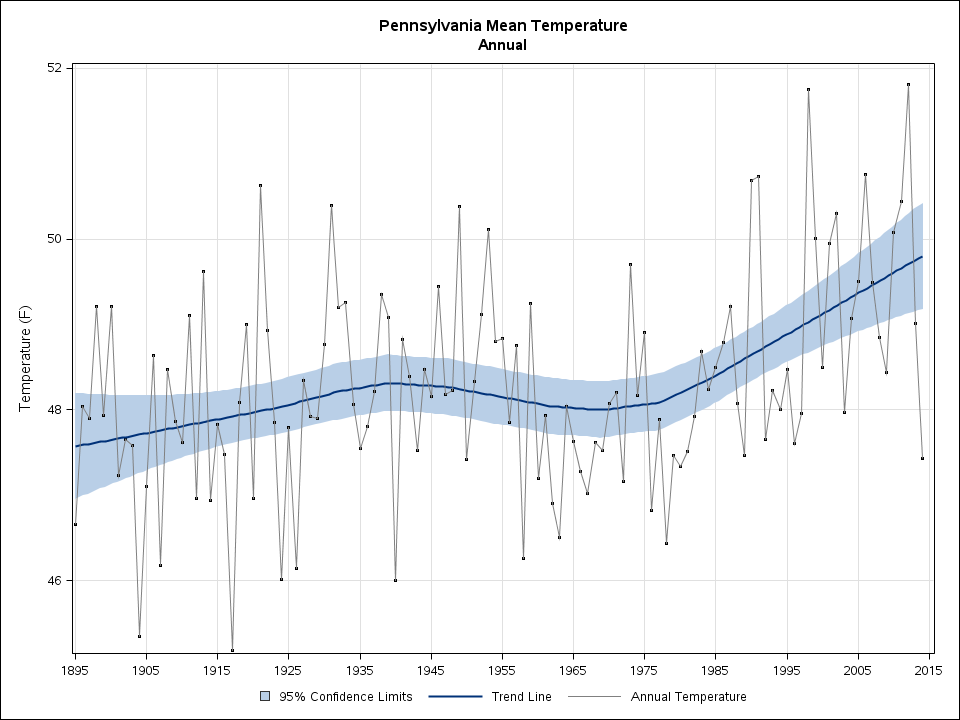 Mean annual temperatures in Pennsylvania since 1895. Source: NOAA State Annual and Seasonal Time Series. Climate changes and the local environment:Average annual temperatures in Pennsylvania have been generally rising since the beginning of the twentieth century. Since 1965, Pennsylvania’s average annual temperature has risen by almost one full degree celsius. While this sharp increase in temperature and rate of change have had relatively few direct impacts on the environment of Allegheny County, the secondary effects have been substantial. Allegheny County has typically had high rates of precipitation, and the county seat, Pittsburgh, lies at the intersection of three major rivers. As a result, it has long been vulnerable to flooding. Asphalt cover in the city has increased the rate of runoff, allowing precipitation to quickly raise water levels in the river while carrying pollution from the streets into the water supply. Flooding in and around Pittsburgh therefore endangers both freshwater ecosystems and human health. Flooding is usually especially severe in the spring, when sudden thawing after heavy snowfall can send meltwater draining into the rivers. Spring temperatures across Pennsylvania have not warmed as quickly as temperatures in other seasons, but they have increased erratically since the 1950s. Meanwhile, annual precipitation has fluctuated from year to year but nevertheless generally increased since 1948. Springtime precipitation has actually decreased slightly, but storms that drop a great deal of rain or snow have become more common. The picture is therefore very complex, but overall humans have made floods more likely in Allegheny County, both by changing Earth's climate and by building infrastructure that cannot absorb precipitation like natural environments can. 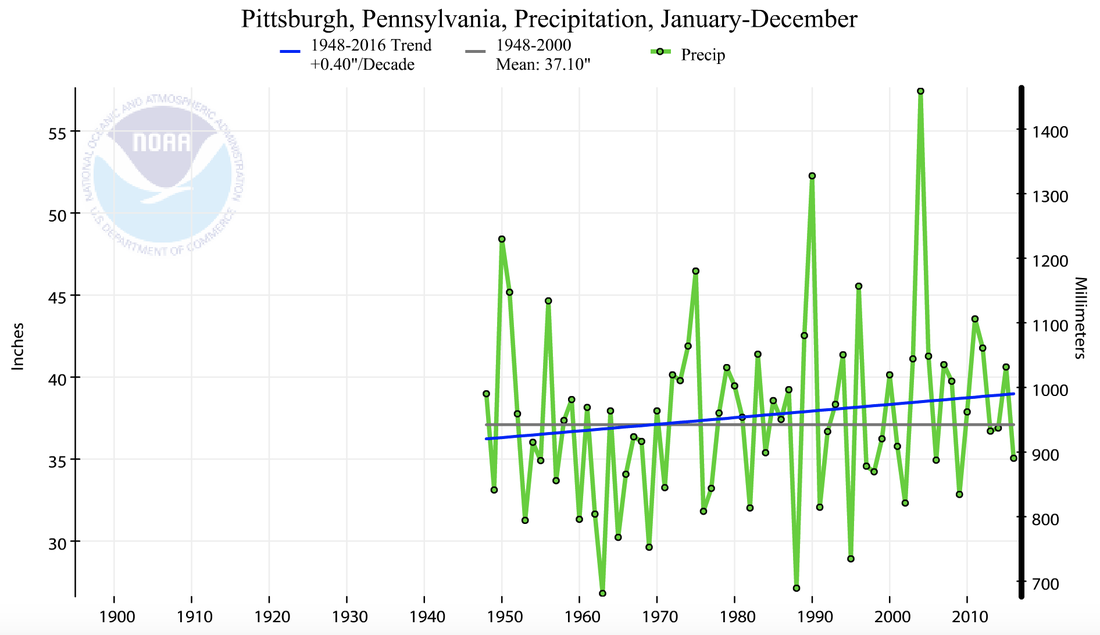 Average annual rainfall in Pittsburgh, relative to a twentieth-century base period, showing an upward trend. Source: NOAA Climate at a Glance. How we know:The reconstructions and historical data compiled to track temperature and precipitation come from mass data-collection efforts by the National Oceanic and Atmospheric Administration (NOAA) State Annual and Seasonal Time Series, the NOAA Temperature, Precipitation, and Drought tools, and the NOAA Climate Resilience Toolkit, as well as several local historical sources. Projections of flooding in Pennsylvania's future draw from the Climate Central/Inner City Fund (ICF) States at Risk tools. These freely available digital resources, combined with local historical sources detailing past floods and incidences of health risk from infrastructural failures, help create a full picture of climate change in Allegheny County. The historical sources rely on contemporary reports of climate-influenced events from newspapers and firsthand accounts, as well as official records pertaining to government regulatory or responsive action. 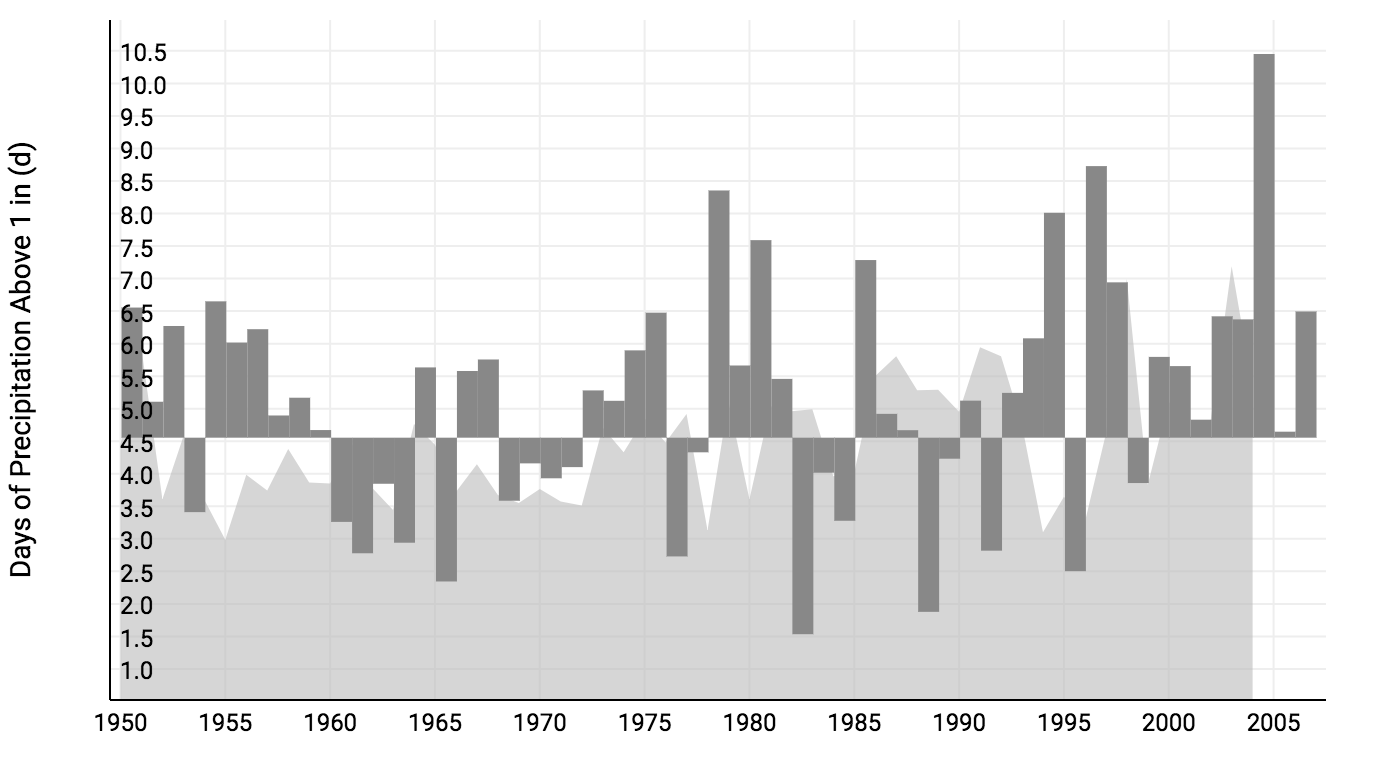 Modeled (grey shadow) and observed (grey bars) precipitation in Allegheny County. Observed values are relative to a 1960-89 baseline. Source: NOAA U.S. Climate Resilience Toolkit (Climate Explorer). Human consequences:The increasingly frequency of precipitation extremes across Pennsylvania are a risk to Allegheny County infrastructure. The county's water treatment center, ALCOSAN, admits that any more than one-tenth of an inch of rain can overflow the sewer system and send raw sewage into local waterways. The county currently copes with these disasters by posting Combined Sewer Overflow (CSO) warnings at local beaches or boat-accessible waterways to keep individuals from coming into contact with contaminated water. In the past three years, time lost to CSO days has increased significantly. In 2014, there were 50 CSO alerts, 54 in 2015, and 65 in 2016, and CSOs have lasted an average of 4-5 days since 1995. That adds up to over half the days of the recreational boating season. Every CSO period limits recreational activities and revenue from those recreational activities. Rehabilitating the sewage system to prevent CSO events will cost around $3 million. CSOs are a frequent occurrence even with moderate rainfall, but Pittsburgh is also at risk for more severe flooding. Significant floods in 1889, 1907, 1936, 1964, and 1996, as recorded by the Heinz History Center, have deeply influenced the community’s view of its environment and caused major infrastructural and financial losses. Flooding in and around Allegheny County is likely to have even more dramatic impacts in the future. According to FEMA’s 100-year floodplain projections, over 430,000 Pennsylvanians live in areas likely to suffer flood damage in the next century, and the risk of flooding is projected to increase with each year. On the edge of three rivers, with poor flood-protection infrastructure and a weak water treatment system, Pittsburgh has been and continues to be vulnerable to the impacts of climate change. Further reading:The Flood of 1996. National Weather Service About the Weather Issue. 3 Rivers Wet Weather America’s Preparedness Reportcard. States at Risk Allegheny County, Pa., Emphasizes 'Green' Infrastructure in $2 Billion Stormwater Control Effort. Future Structure Article author: Madelyn Rice, Georgetown University
Article editor: Dr. Dagomar Degroot, Georgetown University 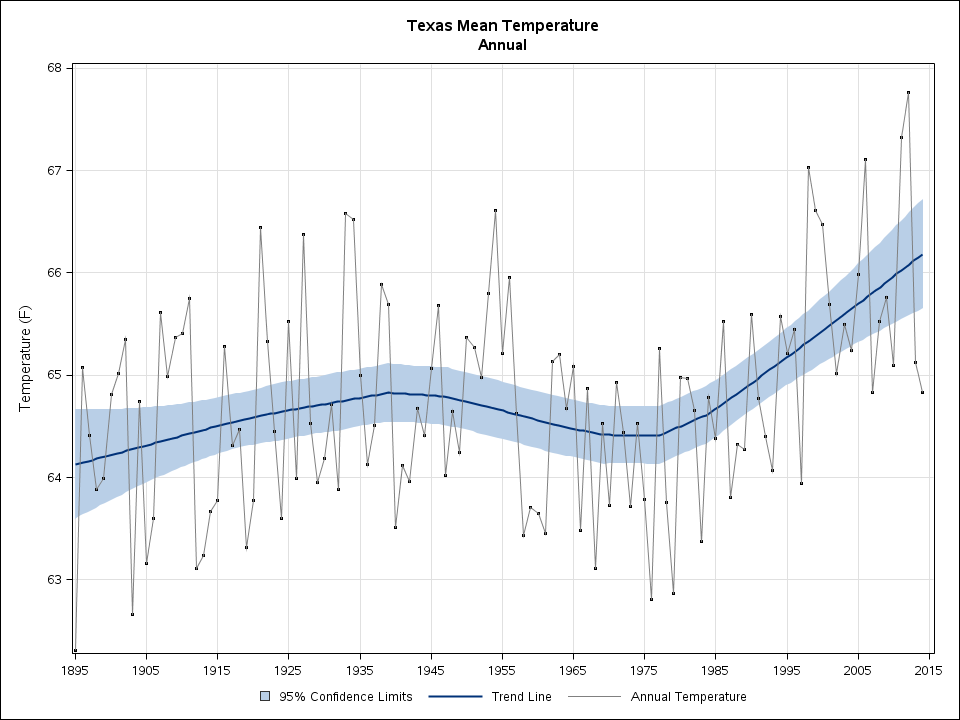 Mean annual temperatures in Texas since 1895. Source: NOAA State Annual and Seasonal Time Series. Climate changes and the local environment:For decades, global warming has increased sea levels in most coastal regions. Glacial meltwater has poured into the oceans, while warming water has expanded, taking up more volume and therefore sending sea levels ever higher. Communities at risk of major tropical cyclones - such as Galveston county, Texas - have faced the full consequences of these changes to the world's oceans. Hurricanes are fueled by warm, moist air rising from warm water. The warmer the water, the more fuel hurricanes can use. While global warming has likely not increased the frequency of hurricanes overall, it has increased the frequency of exceptionally severe storms. Currently, powerful hurricanes are up to 11% stronger and more dangerous for communities such as Galveston. A hurricane's winds usually cause the greatest damage to human infrastructure by pushing ashore enormous quantities of water. These "storm surges" are highest in powerful hurricanes, which means that they are more frequently destructive now than they have been. Off Texas, rising sea levels have made them even worse. Between 1957 and 2011, sea levels off Galveston rose by just over a foot, which has greatly increased the damage that will be inflicted to the county in a major hurricane. 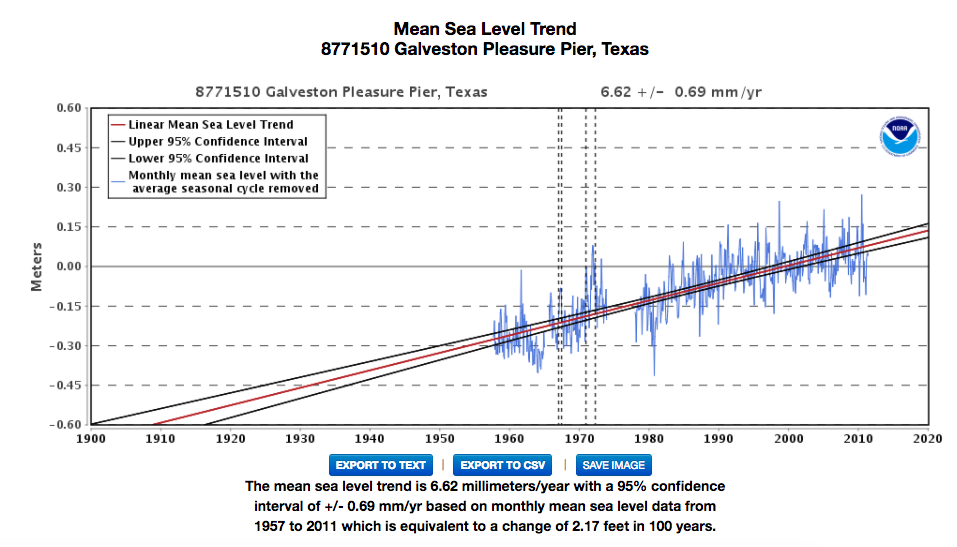 Sea levels off of Galveston, Texas, 1957-2011. Source: NOAA Tides and Currents. How we know:This information is derived from the National Oceanic and Atmospheric Administration (NOAA) study that connects global warming and hurricanes. It also draws from easy to use tools that are available online: the NOAA State Annual and Seasonal Time Series, and the NOAA Tides and Currents resource. NOAA’s GFDL study on Global Warming and Hurricanes pulls data from published articles regarding hurricane intensity and temperature fluctuations since the 1800s. NOAA’s State Annual and Seasonal Time Series is derived from the current U.S. Climate Division Database that pulls data from temperature stations. NOAA’s Tides and Currents produces sea level trends measured from U.S. and Global Stations without the regular seasonal fluctuations due to coastal ocean temperatures, salinities, winds, atmospheric pressures, and ocean currents. 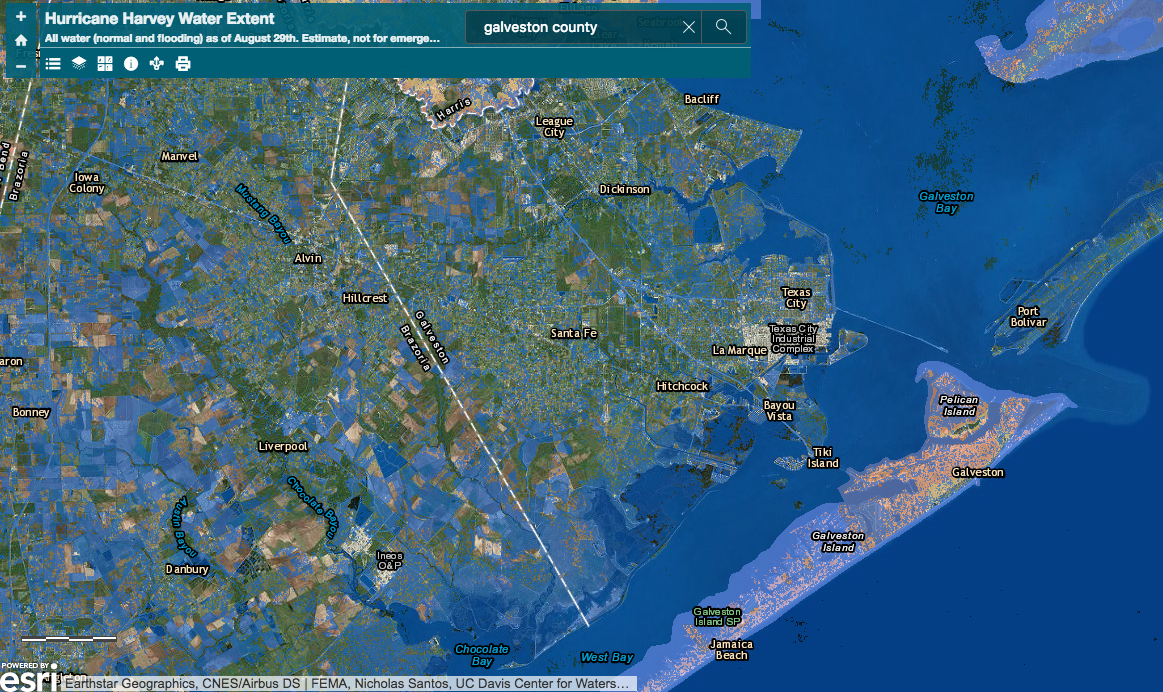 Flooding in Galveston during Hurricane Harvey. Source: UC Davis Center for Watershed Sciences Hurricane Harvey Water Extent Geographic. Human consequences:Galveston became a major U.S. commercial center and one of the largest ports in America during the 19th century. Whenever a major hurricane hits the county, its lack of a sustainable drainage system leaves many of its streets inundated with water for weeks. Without adequate flood safety measures, today 320,000 people are forced to evacuate from their homes at the approach of a hurricane. When these people are displaced and Galveston’s port is flooded, millions of dollars in goods from the commercial port are lost. Thousands of businesses around the United States that receive imported materials through this port are also impacted. Because Galveston County has long had a major commercial port, it has a great deal of infrastructure that is vulnerable to hurricanes. In 1900, it endured the deadliest natural disaster in American history, when the 15-foot storm surge of the Galveston Hurricane killed up to 12,000 people. In 1970, Hurricane Celia, a Category 4 storm, came ashore near Galveston and inflicted nearly $6 billion of damage in 2017 USD. Then, in 2017, Hurricane Harvey inflicted $23 billion worth of property damage in Harris and Galveston counties alone. Galveston County is extremely vulnerable to intense hurricanes, increasing local temperatures, and rising sea levels. As hurricanes strengthen and sea levels rise, the county may be hard pressed to survive the twenty-first century. Further reading:Article author: Kiera McCrane, Georgetown University
Article editor: Dr. Dagomar Degroot, Georgetown University 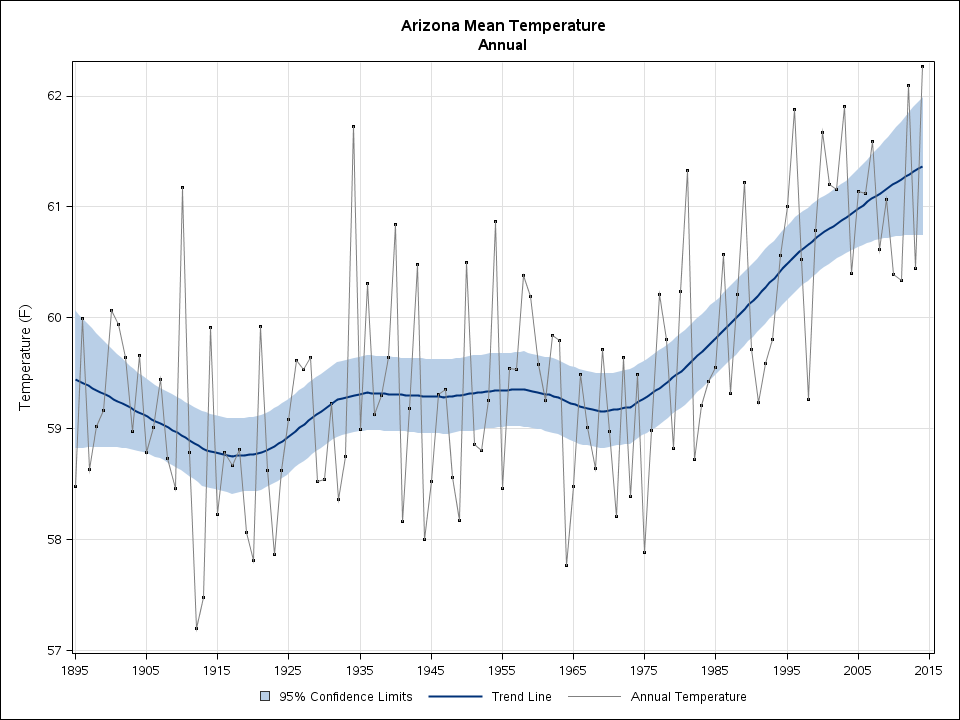 Mean annual temperatures in Arizona since 1895. Source: NOAA State Annual and Seasonal Time Series. Climate changes and the local environment:Mohave County is located in Northwestern Arizona, and includes part of the Grand Canyon National Park, as well as several federally recognized Native American Reservations. Its annual average temperatures have risen by an average of 0.2°F per decade between 1895 and 2016. However, this average hides the fact that average temperatures in the county and the state were mostly stable until roughly 1975. After that year, the trend in average temperatures began rising very quickly, and this caused a worrying increase in the frequency and intensity of wildfires and droughts. These weather and climate-related events have had devastating effects in the local environment. As much as 15 per cent of Arizona is covered by national forests, and the hotter and drier conditions have made it easier for wildfires to occur. According to U.S. Forest Service records, large wildfires (of more than 1,000 acres) in the state have increased from approximately 5 per year before 1980, to a current average of near 20. Drought has affected the Colorado river, a source of water for over 30 million people, including a large share of Mohave County and the State of Arizona. For example, the Upper Colorado Basin has seen more common and severe droughts in the last 50 to 90 years. In the period between 2000 and 2014, the river’s flow declined by 19 per cent compared to the average between 1906 and 1999. Researchers have estimated that warmer temperatures account for up to one-sixth of these losses, which are approximately equal to enough water to support 1 million households for a year. 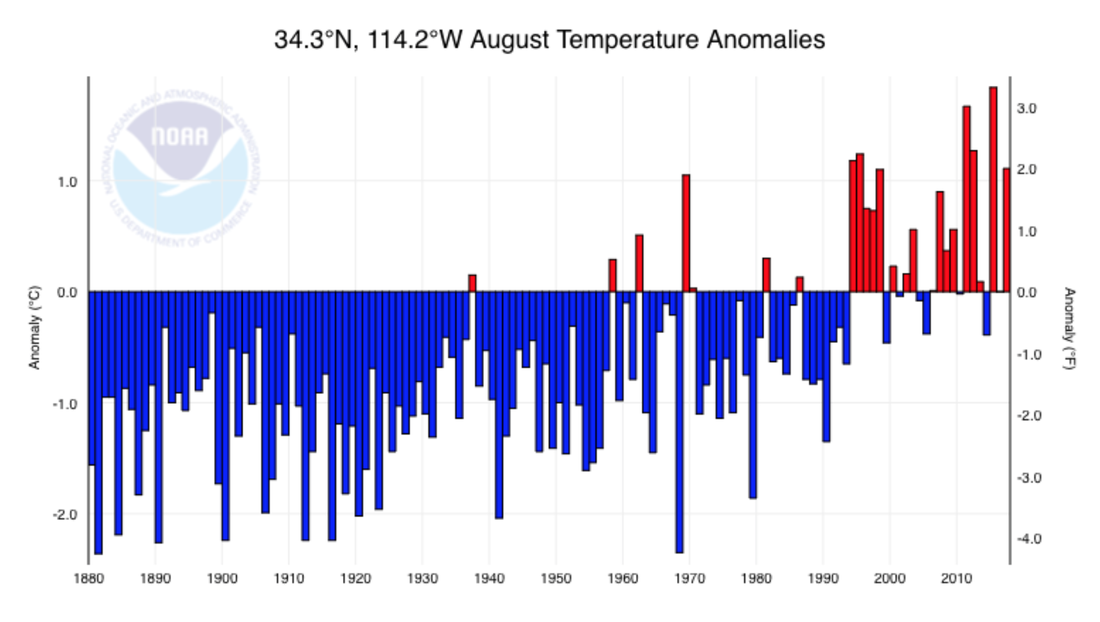 Since the 1990s, Lake Havasu City, a city in Mohave County that borders with Southern California, has seen average temperatures in August that are much higher than the long-term average for that month. Source: NOAA. How we know:These climate and weather reconstructions are based on several tools made available online by several United States agencies, such as the National Oceanic and Atmospheric Administration (NOAA)’s State Annual and Seasonal Time Series. This site is useful to see the evolution of temperatures at the state level since 1895, and its information is obtained from the U.S. Climate Divisional Dataset, used often for agricultural matters. NOAA’s Climate at a Glance tool is intended for studying the changes and variability of climate, and has adjusted the data to take into account artificial effects that affect climate, such as urbanization. Another important resource is the United States Drought Monitor, which develops weekly maps of drought conditions across the country, and uses climate, soil, and water data, together with reports from 350 experts across the country. The U.S. Climate Resilience Toolkit helps people become informed about their risks and opportunities related to the changing climate, and to help them become more resilient. One of its tools is the Climate Explorer, which allows users to explore the potential damaging effects of climate on the population and their valued possessions, such as land and crops. To do this, it shows projections of temperatures, precipitation, and others for two possible futures: one in which humans make a moderate attempt to reduce their carbon emissions, and another in which humans continue to act as usual. 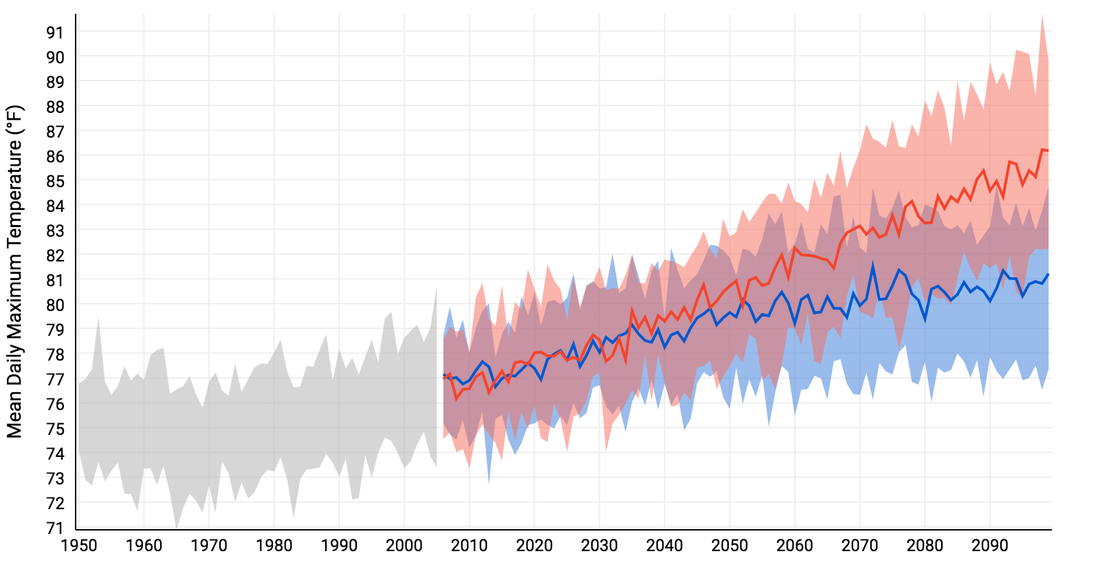 Average daily maximum temperatures in Mohave County, Arizona. Grey shows the historical trend since 1950. Red shows the projection for a future with higher emissions, and blue with lower emissions. Source: NOAA U.S. Climate Resilience Toolkit (Climate Explorer). Some of the biggest effects of climate change in Arizona have been linked to health concerns, disruptions in the water supply for farms and cities, and the destruction of the environment with wildfires. In the summer of 2017, the state made nationwide news when numerous flights were cancelled in Phoenix due the excessive heat. These extreme temperatures caused near 1,300 deaths between 2005 and 2015, and the number of heat-related illnesses has been increasing, according to a medical director at the Banner University Medical Center in Phoenix. The Environmental Protection Agency (EPA) has reported that more than 2 per cent of the land in Arizona has burned per decade since 1984, and the smoke produced often damages the quality of the air and water, and creates health problems for the population. In Mohave County, the most significant human consequences of climate change can be found in the water supply disruption to households, and in the Native American communities. Decreasing water reserves in important bodies of water like Lake Mead, and the increasing water needs due to growing cities and new farms that move from California’s even more extreme water shortage, have led to severe concerns and restrictions on water use. Native American tribes have seen their traditional practices challenged, as they are typically very dependent on agriculture and the raising of livestock, which in turn depend on weather and the availability of water. For the Mohave tribe, a drier Colorado River means a disruption to their traditions, as they believe that the river was created by their ancient deity Mastamho as part of their sacred landscape. Despite this worrisome picture, in a Climate Central report, Arizona’s government received a failing grade for its average level of wildfire preparedness, and a near-failing grade for its drought preparedness, as its plans do not account for the devastating effects of climate change. Further reading:The Future is Drying Up. NY Times Magazine Where the River Runs Dry. The New Yorker The $2.4 Billion Plan to Water California by Draining the Mojave. Wired Wildfires, Once Confined to a Season, Burn Earlier and Longer. NY Times Article author: Alejandro Carrera Rodriguez, Georgetown University
Article editor: Dr. Dagomar Degroot, Georgetown University 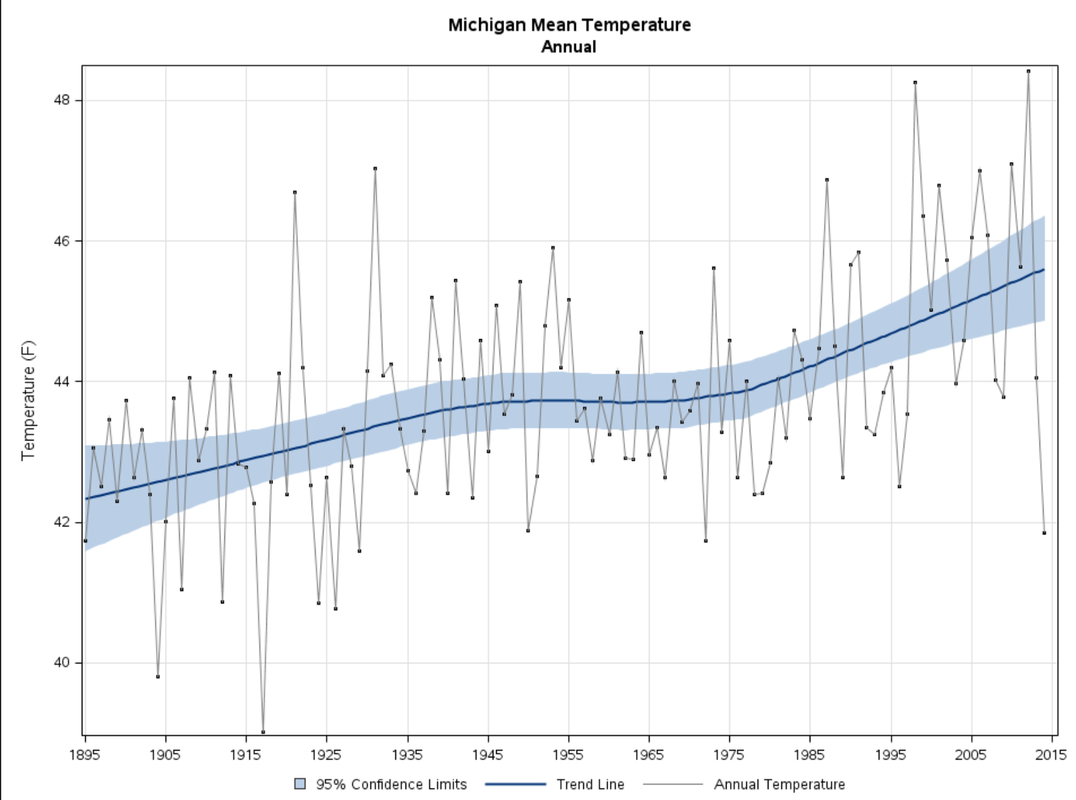 Mean annual temperatures in Michigan since 1895. Source: NOAA State Annual and Seasonal Time Series. Climate changes and the local environment:Genesee County, Michigan has warmed steadily for more than a century. Although average annual temperatures in the state have climbed more slowly than the global trend, they have still risen by around 0.6° C (1.1° F) relative to twentieth-century averages. Michigan is known for its long and snowy winter seasons. Rising temperatures, however, have sharply shortened the length of winter across the state. The total number of days in the winter season with at least 2.5 cm (1 inch) of snow cover has declined sharply since 1920, with most of the decline happening since 1980. As winter grows shorter, snow falls less frequently. Yet that does not necessarily mean that winters have become less snowy across the state. Snowfall trends from county to county vary widely, in large part because water in the nearby Great Lakes cools more slowly than air. If the lakes are largely ice-free, warm water can heat up otherwise cool air blowing into Michigan. The air then absorbs moisture and deposits it as "lake-effect" snow in some, but not all of, Michigan. Now that the Great Lakes are ice-free for much longer than they were, on average, in the twentieth century, blizzards have grown more common in Michigan even as winters have grown shorter. Overall, precipitation in all seasons has increased across Michigan, at a rate of roughly 1.5 mm/year since the 1930s. Much of the increase has come not through extreme events, but a steady rise in wet days that follow wet days. There are signs that cloudiness is now more frequent than it was in the twentieth century. In this context, Genesee County in Michigan has recently endured particularly extreme and destructive weather. In March 2012, for example, temperatures in a normally cold month soared to a record-shattering 31° C (88° F). In January 2014, a severe snowstorm dropped 18 inches of snow on the county, the second-heaviest fall since 1975. 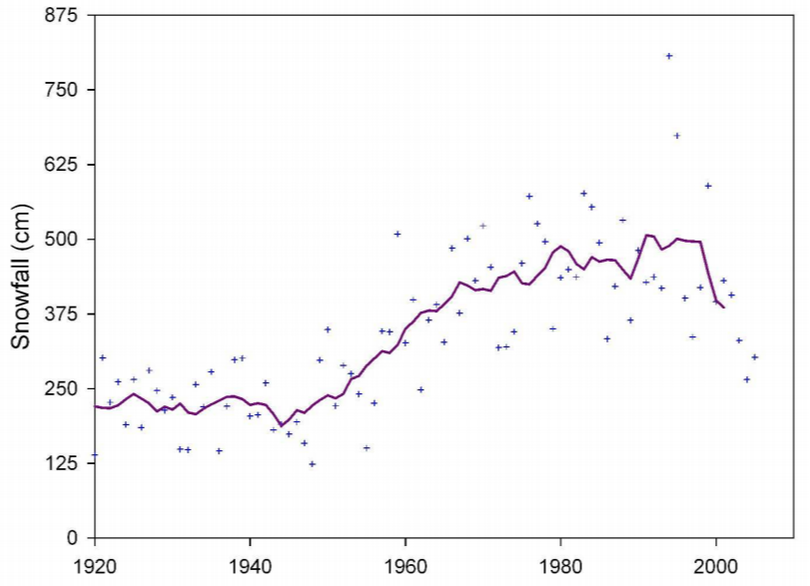 Total seasonal snowfall in nearby Chatham, MI, 1920-2015. Individual years represented by blue points; 9-year moving average in purple. How we know:These reconstructions rely on the National Oceanic and Atmospheric Administration (NOAA) State Annual and Seasonal Time Series and a freely available report, "Historical Climate Trends in Michigan and the Great Lakes Region," by Dr. Jeffrey Andresen of the Department of Geography at Michigan State University. NOAA's State Annual and Seasonal Time Series relies largely on weather station measurements. Adresen's report largely draws on data collected by weather instruments but also includes information from other sources, such as observations from aircraft. Human consequences:Heat waves and blizzards brought about by rising temperature trends have imposed high costs on Michigan, including Genesee county. Nation-wide statistics suggest that the elderly, especially those with limited mobility and insufficiently insulated or air conditioned houses, are in great danger during both extreme heat and blizzards. Heat waves can also damage roads and train tracks, impose strains on energy and water resources, and lower crop yields if they arrive in key development stages. Yet in Michigan, a trend towards wetter weather may also have had beneficial impacts for regional agriculture. Computer simulations show that increases in soil moisture available to corn at mid-season, and a rise in plant-available water in the soil profile over the whole season, have both increased corn yields across Michigan. Until now, global warming has therefore had a complex mix of beneficial and destructive impacts on Michigan, and therefore on Genesee county. Article author: Diana Lowitt, Georgetown University
Article editor: Dr. Dagomar Degroot, Georgetown University 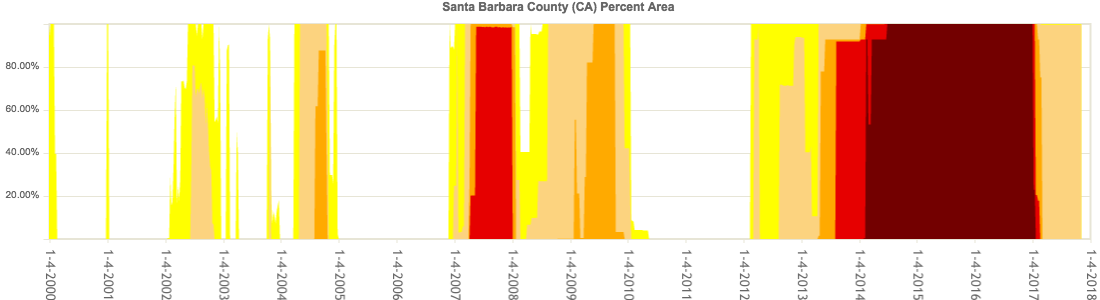 Drought severity in Santa Barbara County from 2000 until 2017, showing the landmark drought of 2014-2017. Darker colors represent worse droughts; higher values mean more of the county was in drought. Source: United States Drought Monitor. Climate changes and the local environment:Average annual temperatures across California have been rising since the nineteenth century, a trend that has sharply accelerated since around 1970. Average temperatures across all seasons in Tulare County in south central California have mirrored that statewide pattern. As the county warmed, it suffered a series of severe droughts, which are usually defined as long-lasting moisture deficits that have environmental and social consequences. Droughts in the county involve three sources of water: surface water at low elevations, snow at high elevations, and groundwater buried below the surface. Precipitation in much of California has long varied by as much as 50% from year to year. Hotter temperatures, however, are increasing the rate of evaporation across California, including in Santa Barbara County. That has affected both mountain snow and lowland liquid water, and has made local droughts even longer and drier than they once were. One of the most severe droughts in the county's history recently began in February 2012 and lasted into 2017. The driest stretch of the drought started in February 2014 and endured until January 2017. It was part of a broader Californian drought that started in coastal areas several years earlier, and was up to 27% more likely to occur in our warmer climate. Longer, drier summers and an earlier snowmelt have caused drier forest conditions in southwest California, which has increased the amount of available kindling for wildfires to consume. These conditions have increased the size and duration of wildfires in California, and dramatically lengthened the wildfire season in Santa Barbara county. How we know:These reconstructions rely on several easy to use tools that are available online: the National Oceanic and Atmospheric Administration (NOAA) State Annual and Seasonal Time Series, the NOAA Weekly Palmer Drought Indices, the National Drought Mitigation Center's United States Drought Monitor, and the United States Geological Survey (USGS) interactive website. NOAA's State Annual and Seasonal Time Series relies largely on weather station measurements. NOAA's Palmer Drought Indices use a standard way of measuring drought that considers both water supply and demand in a soil moisture model. Negative values represent droughts, and positive values represent wet conditions. The United States Drought Monitor uses a number of drought indicators, including the Palmer Drought Indices, that consider both environmental and social manifestations of water shortages. The interactive tools made available by the USGS draw on open data provided by a range of United States government agencies, including the Army Corps of Engineers and the Bureau of Reclamation. 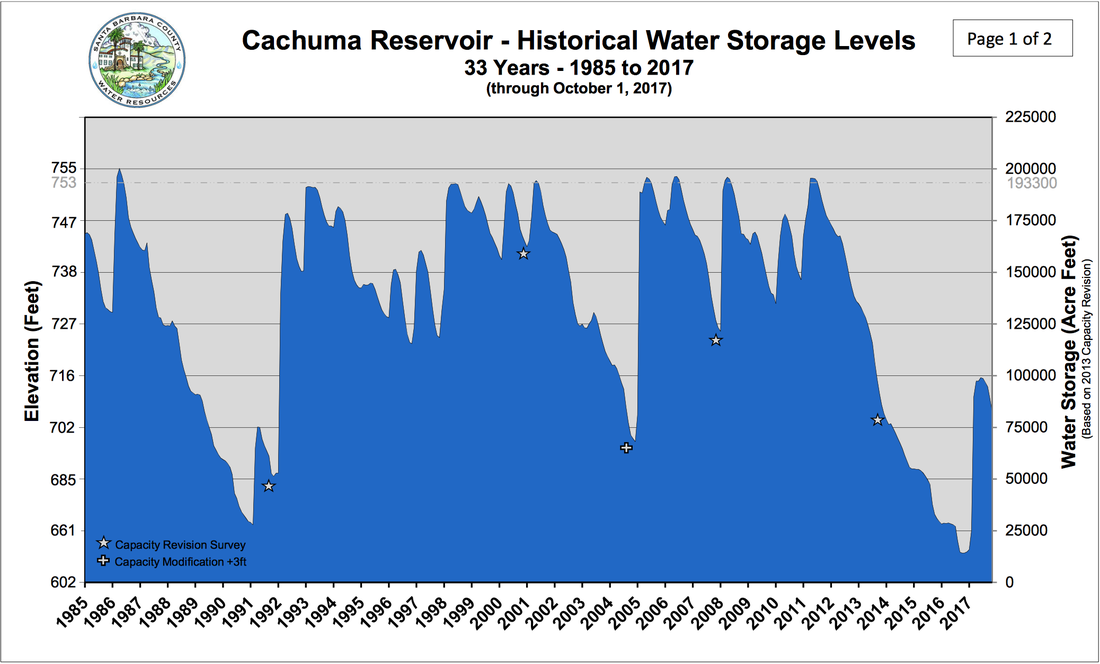 Water levels in Cachuma reservoir responded to the Californian drought. Human consequences:Droughts can sharply reduce the quantity of water in reservoirs and aquifers across California, which often supply water to local residents. Reservoirs, which collect precipitation, and aquifers, which are the groundwater storage spaces, both contribute to Santa Barbara’s water supply. This supply is crucial for both commercial and industrial use. If global warming continues, Santa Barbara’s premium wine industry could be significantly affected. This is because distinct grape species can only thrive in specific temperature ranges. If Santa Barbara fails to produce grapes that can tolerate higher temperatures, then the decline in suitable land could be up to 20%. Wine is currently the third-most produced commodity in Santa Barbara county, and wine sales comprise nearly a tenth of the county's economy. One of the main water sources that supplies residents in Santa Barbara county is the Lake Cachuma reservoir. The reservoir supplies 85 percent of the water supply for over 250,000 residents of Goleta district in Santa Barbara county. Its available water supply plummeted during the California drought. As of October 1st 2017, it is still only 43% full. The lack of water in the Cachuma reservoir, in conjunction with the drought, will force Santa Barbara county to search for alternative water sources. Just recently, the county decided to reopen its desalination plant to supply more water to their residents. The reactivation of this plant cost the county an estimated $71 million, not including the cost of maintaining the plant. It will supply 3 million gallons of water per day to residents to cover 30% of the city’s water usage. In a warmer and drier future, such desperate measures may well be necessary across California. Article author: Madeline Lee, Georgetown University
Article editor: Dr. Dagomar Degroot, Georgetown University 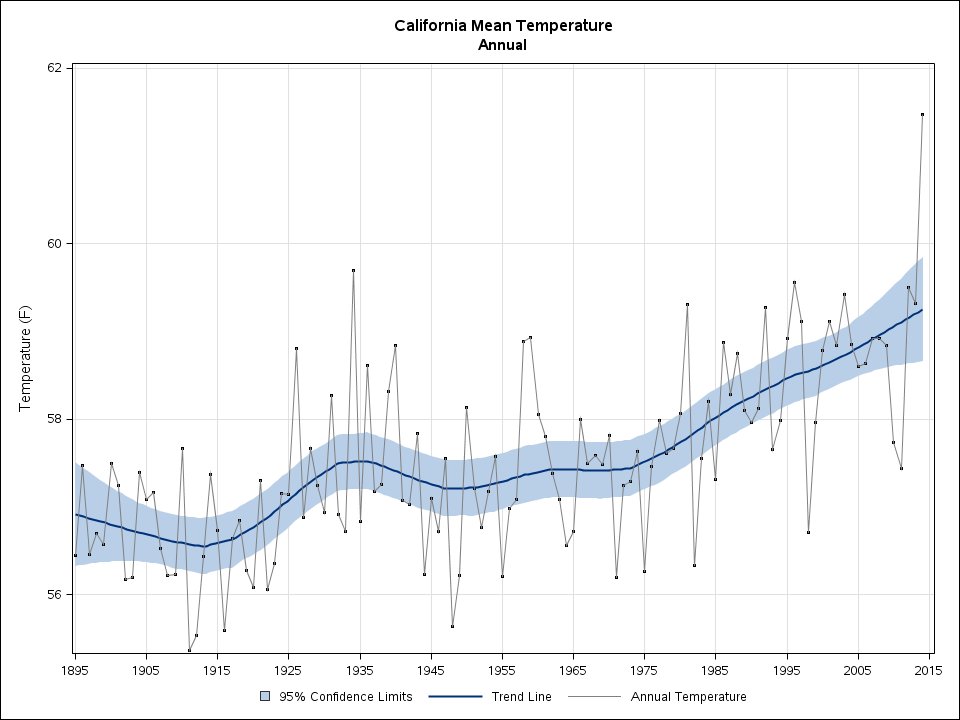 Mean annual temperatures in California since 1895. Source: NOAA State Annual and Seasonal Time Series. Climate changes and the local environment:Average annual temperatures across California have been rising since the nineteenth century, a trend that has sharply accelerated since around 1970. Average temperatures across all seasons in Tulare County in south central California have mirrored that statewide pattern. As the county warmed, it suffered a series of severe droughts, which are usually defined as long-lasting moisture deficits that have environmental and social consequences. Droughts in the county involve three sources of water: surface water at low elevations, snow at high elevations, and groundwater buried below the surface. Precipitation in much of California has long varied by as much as 50% from year to year. Hotter temperatures, however, are increasing the rate of evaporation across California, including in Tulare County. That has affected both mountain snow and lowland liquid water, and has made local droughts even longer and drier than they once were. One of the most severe droughts in the county's history recently began in 2014 and lasted until early 2017. It was part of a broader Californian drought that started in coastal areas several years earlier, and was up to 27% more likely to occur in our warmer climate. 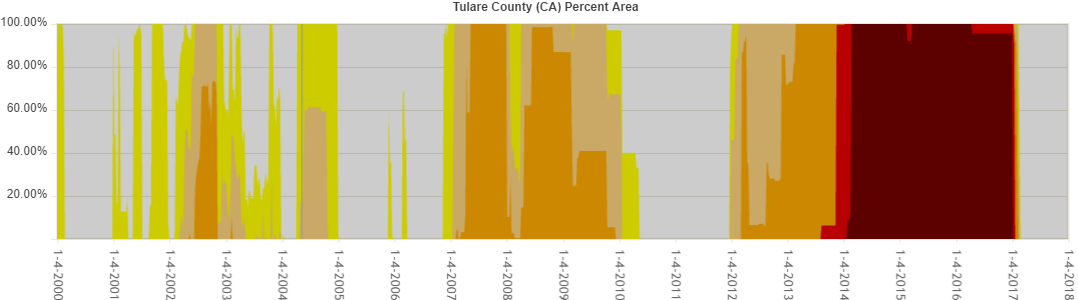 Drought severity in Tulare from 2000 until 2017, showing the landmark drought of 2014-2017. Darker colors represent worse droughts; higher values mean more of the county was in drought. Source: United States Drought Monitor. How we know:These reconstructions rely on several easy to use tools that are available online: the National Oceanic and Atmospheric Administration (NOAA) State Annual and Seasonal Time Series, the NOAA Weekly Palmer Drought Indices, and the National Drought Mitigation Center's United States Drought Monitor. NOAA's State Annual and Seasonal Time Series relies largely on weather station measurements. NOAA's Palmer Drought Indices use a standard way of measuring drought that considers both water supply and demand in a soil moisture model. Negative values represent droughts, and positive values represent wet conditions. The United States Drought Monitor uses a number of drought indicators, including the Palmer Drought Indices, that consider both environmental and social manifestations of water shortages. The above reconstructions also draw on an important study in Geophysical Research Letters, which estimates the possible contribution of global warming to the 2012-2014 drought in California. Human consequences:Severe droughts since the 1970s have badly hurt Californian farmers. In 2015 alone, farmers could not grow crops on nearly 500,000 acres of farmland, which accounted for a large share of the drought's annual economic cost to the state of nearly $3 billion. Tulare county was among the hardest-hit communities. The county has been one of the most productive agricultural counties in the United States. Its economy depends on the dairy industry, as well as crops such as oranges and grapes, which all require abundant water. Not only did these industries suffer particular hardships during the drought, but the drought also lasted longer in Tulare than it did in most other Californian counties. In 2014, the Tulare county Board of Supervisors declared a state of emergency and requested water transfers into the county from other parts of California. Yet hundreds of local wells remained dry into 2017. Many of the county's farms resorted to over-exploiting groundwater that may never fully recover, leaving them more vulnerable to future droughts that a changing climate will make longer and drier. While the recent drought has now ended, it may have long-lasting consequences for local agriculture. Further reading:
Article author: Dr. Dagomar Degroot, Georgetown University
|
 RSS Feed