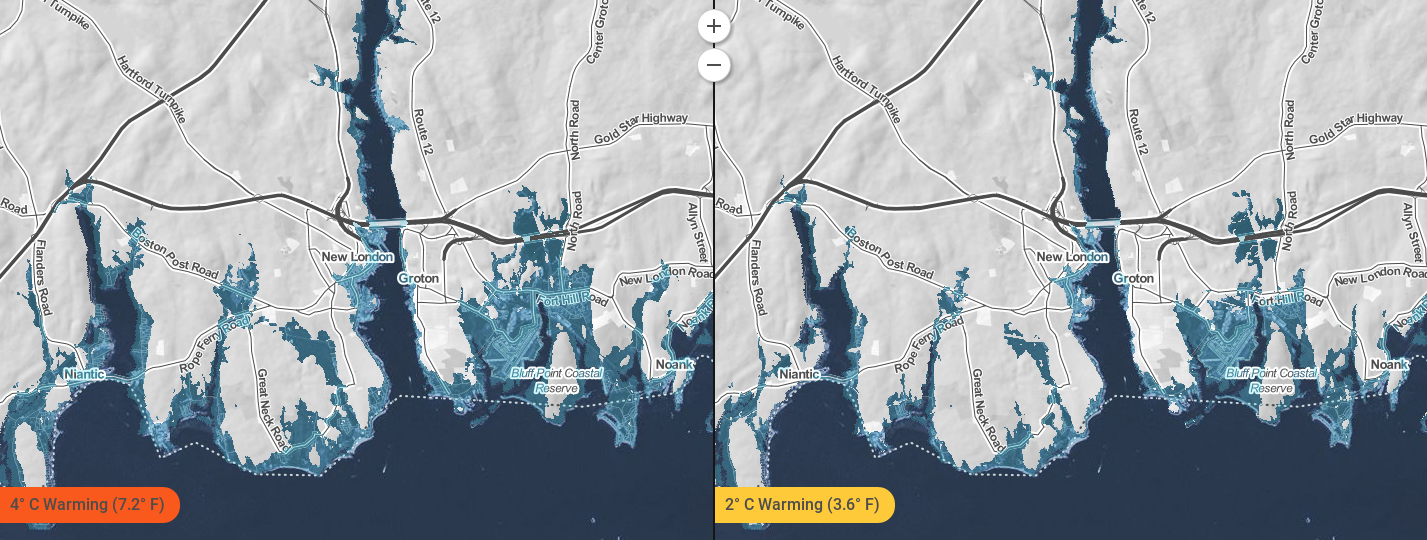
 Changes to the New London County coastline under two different emissions scenarios. Source: Climate Central Surging Seas: Mapping Choices. Climate changes and the local environment:Mean global sea levels have risen by at least 17 centimeters (nearly 7 inches) in the twentieth century. Yet regional variations in ocean temperatures, prevailing winds, ocean currents, and the rise or fall of Earth's crust mean some areas have experienced, and will experience, greater sea level increases than others. Off Connecticut, for example, sea levels are today increasing more quickly than the global average. Connecticut is in fact sinking as its crust slowly recovers from the immense weight of glaciers that covered it during the last ice age. Connecticut is sinking by over 0.03 inches per year, even as Earth's ocean rise. Rising sea levels and sinking land will have dire consequences for the environment of New London County in Connecticut. Low-lying coastal lands in and around the county will eventually be inundated, overwhelming natural flood and storm barriers such as beaches and wetlands. That will make the county ever more vulnerable to coastal storms and flooding, which will grow more frequent and severe as Earth's climate warms. In fact, the Connecticut Governor’s report predicts that by 2050, New London County may face a 100-year storm every 56 years. A 100-year storm refers to a storm of such rarity and magnitude that it has only a 0.1 percent chance of happening in New London County in any given year. Meanwhile, precipitation is on the rise in New London County as local temperatures warm. Hotter air holds more water vapor than cold air, so it is no surprise that average annual precipitation is increasing, while extreme precipitation events - such as torrential rains - are growing more frequent. Both trends are expected to accelerate in the future. Stronger storms sweeping in from the sea are therefore projected to bring more coastal floods in the warmer future, while heavier rains lead to more river floods in New London County. 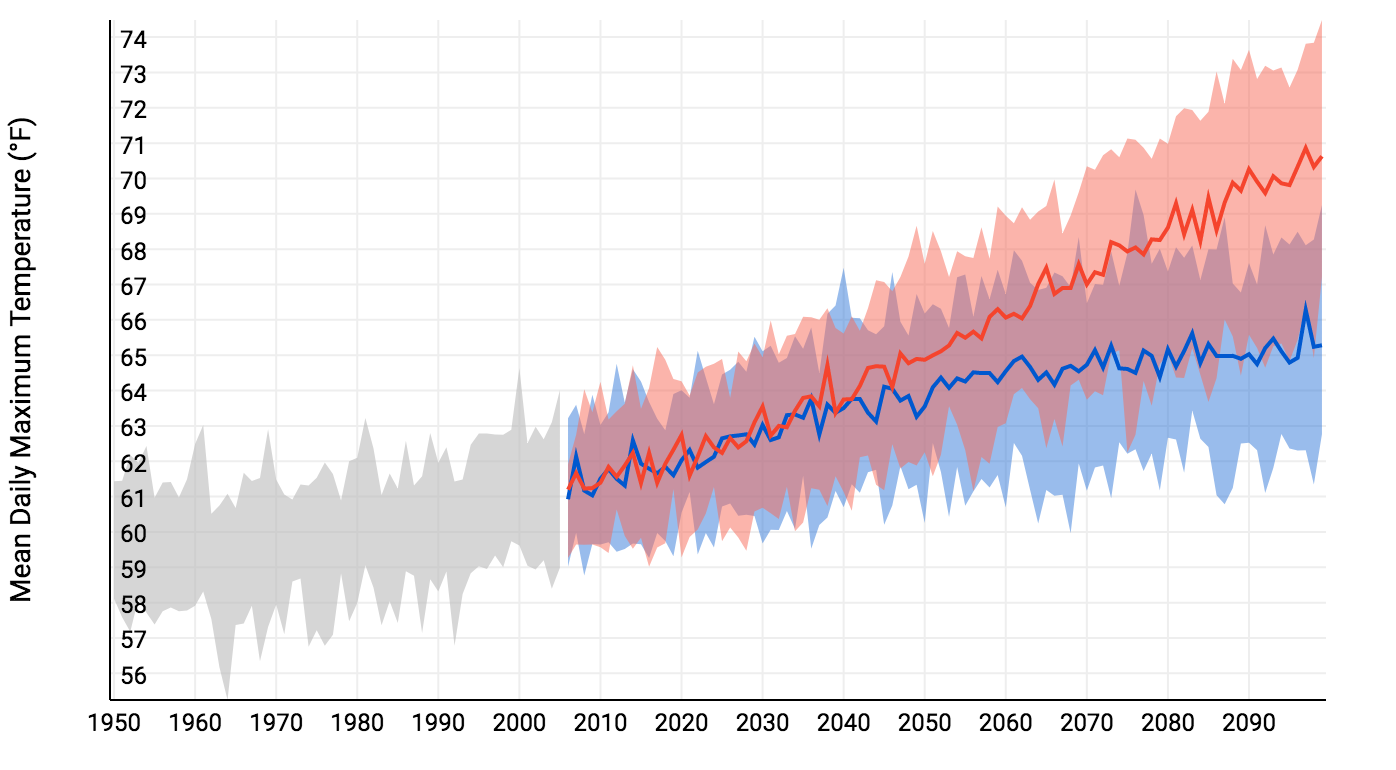 Past and projected changes to the daily high in New London County. Red shows the projection for a future with higher emissions, and blue with lower emissions. Source: NOAA U.S. Climate Resilience Toolkit (Climate Explorer). How we know:These predictions are based on four easy to use tools that are freely accessible online: National Oceanic and Atmospheric Administration (NOAA) Sea Level Trends app, the NOAA Climate Explorer app, and the Climate Central Surging Seas, Mapping Choices app, and the Aqueduct Global Flood Analyzer. The Sea Level Trends tool shows regional mean sea level changes from the twentieth century through today. NOAA collects data for these measurements through the 142 long-term tide stations of the National Water Level Observation Network, which has been measuring sea level for over 150 years. Each regional mean sea level rise or fall is computed using a minimum of 30 years of data to ensure accuracy. The Climate Explorer tool uses weather information recorded by meteorological instruments at weather stations to reconstruct past climate changes. It uses supercomputer simulations of future climate changes under both high and low emissions scenarios. The Surging Seas tool combines historic flood statistics and local sea level trends with global scenarios of sea level increases, which were compiled in the 2014 U.S. National Climate Assessment. The Global Flood Analyzer estimates the vulnerability of regions to flooding, providing figures for the cost of flood damage and number of people affected. 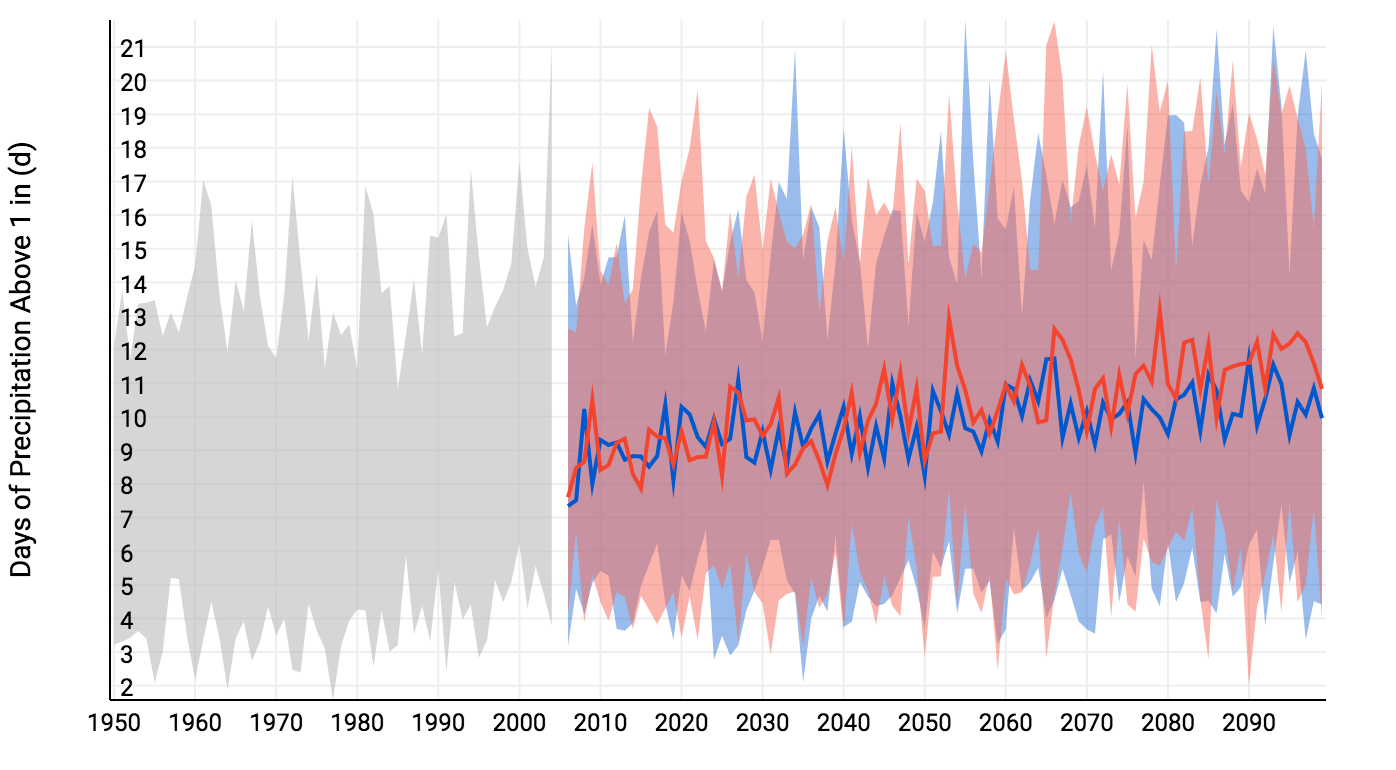 Past and projected days, per year, with more than one inch of precipitation in New London County. Red shows the projection for a future with higher emissions, and blue with lower emissions. Source: NOAA U.S. Climate Resilience Toolkit (Climate Explorer). Human consequences:New London County is already coping with climate change. In 2010, New London endured a 100-year flood after heavy rains caused rivers to spill their banks and ground water to overflow sewage systems. The Federal Emergency Management Agency (FEMA) estimated that the flood cost the county $5.3 million in losses and damages. Precipitation trends will make such floods more common. In New London County, a total of 4,306 residents currently live in homes that are less than 6 feet above sea level. By 2030, there is a 67% chance that flood with waters 6 or more feet above sea level will occur, which would put all these lives and homes at risk. Increased intensity and frequency of both coastal storms and flooding is hugely detrimental to infrastructure and business in New London County. In particular, the Naval Submarine base and the General Dynamics Electric Boat Corporation submarine construction yard, which is the primary builder of submarines for the U.S. Navy, are at risk from sea level rise, storms, and flooding. These establishments are essential to the county’s economy and to national security. Re-engineering of the base and the submarine construction yard may be necessary in order to keep them functional in the face of rising sea levels, yet this would be staggeringly expensive. The consequences of climate change and global warming have already harmed many of coastal communities in New London County. Under all future emissions scenarios, even very optimistic ones, further damage is all but inevitable. Further reading:Climate Change Primer - Sea Level Rise and Coastal Storms. State of Connecticut Climate Suggests Floods will Probably Happen Again. The Day Article author: Georgia Brainard, Georgetown University
Article editor: Dr. Dagomar Degroot, Georgetown University
3 Comments
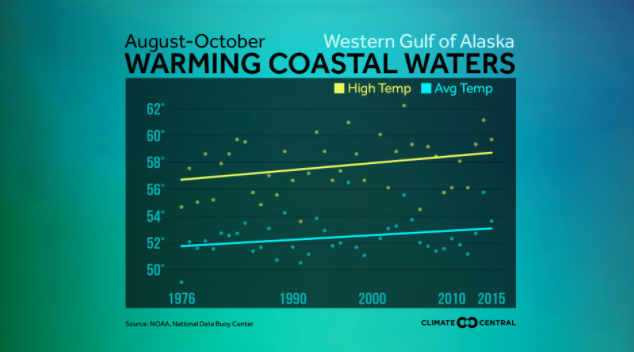 Average and annual high temperatures in the waters of the Western Gulf of Alaska, 1976-2015. Climate changes and the local environment:Between 2013 till early 2017, the east pacific along the west coast of the United States experienced incredibly high temperatures. In 2013, a patch of alarmingly warm water developed along the Gulf of Alaska, due to a force called “The Blob.” The Blob was a patch of warm air that built up when decreased winds failed to distribute and cool the sea surface. In January of 2014, a natural cycle called the Pacific Decadal Oscillation (PDO) shifted to a warm phase and began adding to the pre-existing heating from the Blob. The PDO naturally alternates between periods of warming and periods of cooling along the Gulf of Alaska, and in 2014 it began a warming trend that continued into 2016. However, while the PDO is a natural cycle, it is likely that it has been increasingly impacted by human caused climate changes in the last 30 years. Human actions, such as greenhouse gas emissions, have led to increases in temperature, which intensify the natural warming of the PDO. While they have already begun to have an impact on Sitka and the Gulf of Alaska, these human effects will only continue to magnify the PDO’s effect further in the next few decades, as sea surface temperatures continue to increase. Because of the high temperatures in the Gulf of Alaska, a toxic algae bloom formed along the coast of Sitka and lasted longer than normal. Algae flourishes in hot areas, so the unusually warm trend was perfect for growth. 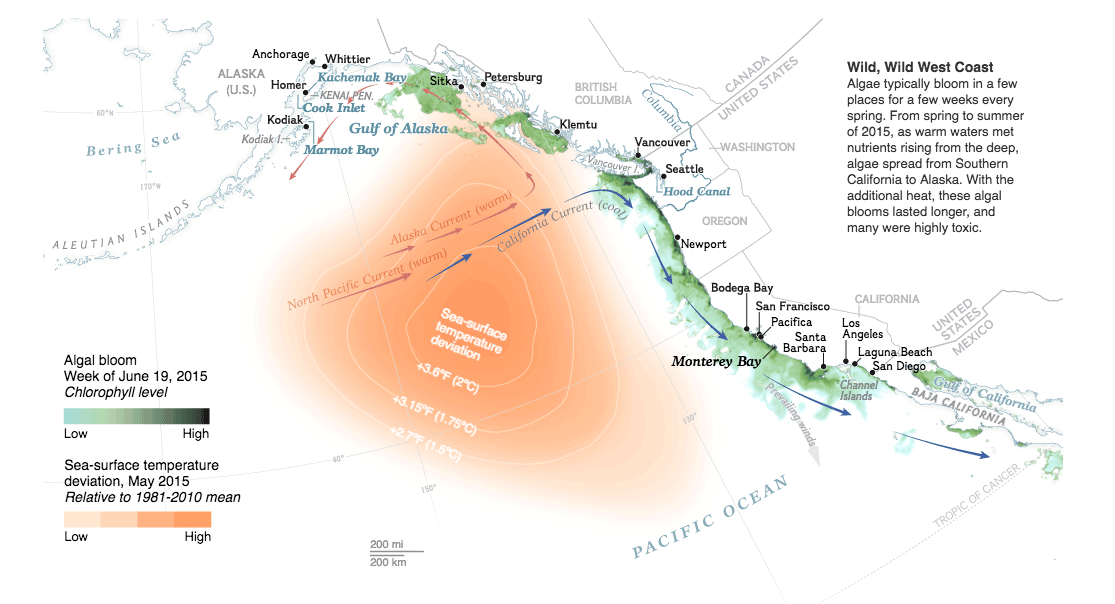 Warm sea surface temperatures and toxic algae off Alaska, 2015. Source: Lauren E. James, NGM Staff; Nick Bond, University of Washington; Raphael Kudela, University of California Santa Cruz. How we know:The warming trends seen in the Gulf of Alaska between 2013 and 2016 can be accessed online through various sources, such as the National Oceanic and Atmospheric Administration (NOAA) Northwest Fisheries Science Center and the NOAA National Data Buoy Center. NOAA’s buoy data has been organized in this article to show the rising temperatures along the United State’s coastal waters. NOAA’s data on sea surface temperature is gathered from satellites observations and from drifting buoys stationed along coasts that collect temperatures at different depths. Data on algal blooms is collected by sampling water along the coast and counting the algae present in the sample. This article from National Geographic shows the trend between the increased temperatures starting in 2013 and algal blooms. Large scale changes in climate such as the PDO can be modeled by combining measurements of sea ice, taken by satellite measurements, with sea surface temperatures overtime. This study from the journal Climate Dynamics uses these two measurements to discuss the likely connection between human caused warming and magnified PDO cycles. Human consequences:The increase in temperature along the coast of Sitka killed zooplankton on a large scale. With zooplankton populations low, animals that rely on plankton for food and others further up the food chain, like starfish, sea birds, whales, and sea otters, experienced large die offs. These trends also impacted the Coho salmon populations, leading to a harvest in 2016 that was below the 10 year average. Impacts of the warming trend in 2015 and 2016 will not be observed for the Chinook salmon until later in 2017, but they are predicted to have a similarly negative impact. In an economy where 1 in 10 jobs are supported by salmon, decreases in Salmon production have major impacts on the community. The large-scale algal bloom also put Sitka’s subsistence harvesters at risk. The toxic algae collect in the body of shellfish as water filters through them. When people harvest and eat infected shellfish, the toxins from the algae can cause symptoms as severe as brain damage or death. The first death in Sitka recorded as a result of poisoned shellfish appeared in 1799 and more have continued to pop up throughout the years. Large-scale algal blooms, like the one in 2015, spread the toxins and put the harvesters of Sitka at risk. Shellfish that is collected on the Sitka shore provide a cheap source of protein that is becoming increasingly vulnerable. While the effects of the Blob and PDO began receding in 2017, they foreshadowed how the ocean will look in a warming world. For the people of Sitka in particular, a warmer ocean could undermine local food sources and employment. Further reading:Paralytic Shellfish Poisoning (PSP) Warning Issued for Southeast Alaska. Sitka Local Foods Network Harmful Algal Blooms—Exacerbated by Warming Ocean Temperatures. U.S. Climate Resilience Toolkit Run Forecasts and Harvest Projections for 2017 Alaska Salmon Fisheries and Review of the 2016 Season. Alaska Department of Fish and Game Article author: Eve Kelly, Georgetown University
Article editor: Dr. Dagomar Degroot, Georgetown University 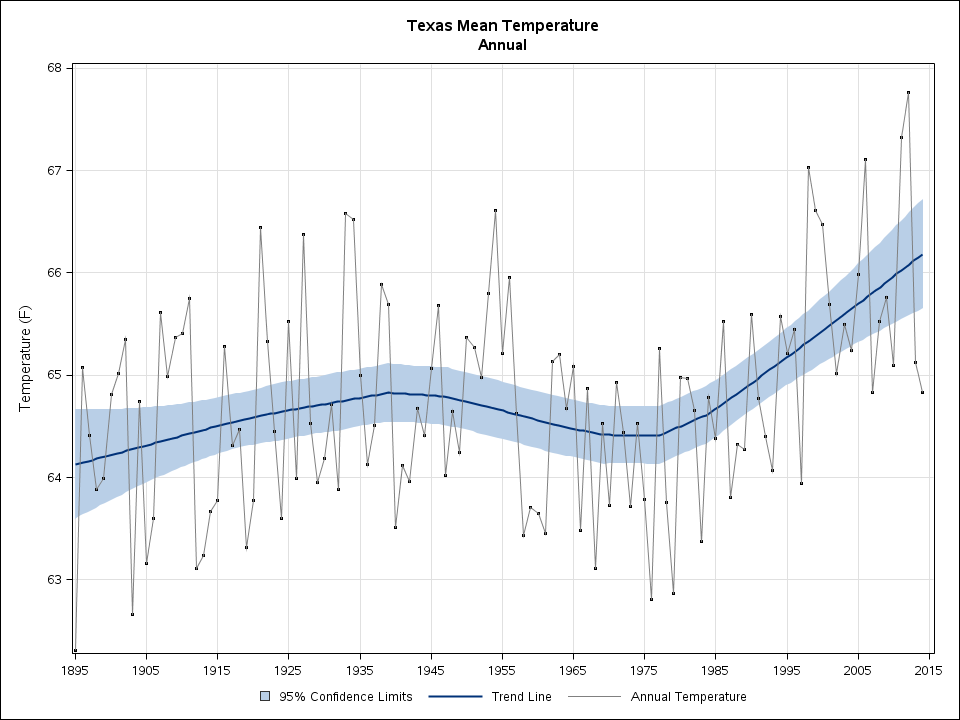 Mean annual temperatures in Texas since 1895. Source: NOAA State Annual and Seasonal Time Series. Climate changes and the local environment:For decades, global warming has increased sea levels in most coastal regions. Glacial meltwater has poured into the oceans, while warming water has expanded, taking up more volume and therefore sending sea levels ever higher. Communities at risk of major tropical cyclones - such as Galveston county, Texas - have faced the full consequences of these changes to the world's oceans. Hurricanes are fueled by warm, moist air rising from warm water. The warmer the water, the more fuel hurricanes can use. While global warming has likely not increased the frequency of hurricanes overall, it has increased the frequency of exceptionally severe storms. Currently, powerful hurricanes are up to 11% stronger and more dangerous for communities such as Galveston. A hurricane's winds usually cause the greatest damage to human infrastructure by pushing ashore enormous quantities of water. These "storm surges" are highest in powerful hurricanes, which means that they are more frequently destructive now than they have been. Off Texas, rising sea levels have made them even worse. Between 1957 and 2011, sea levels off Galveston rose by just over a foot, which has greatly increased the damage that will be inflicted to the county in a major hurricane. 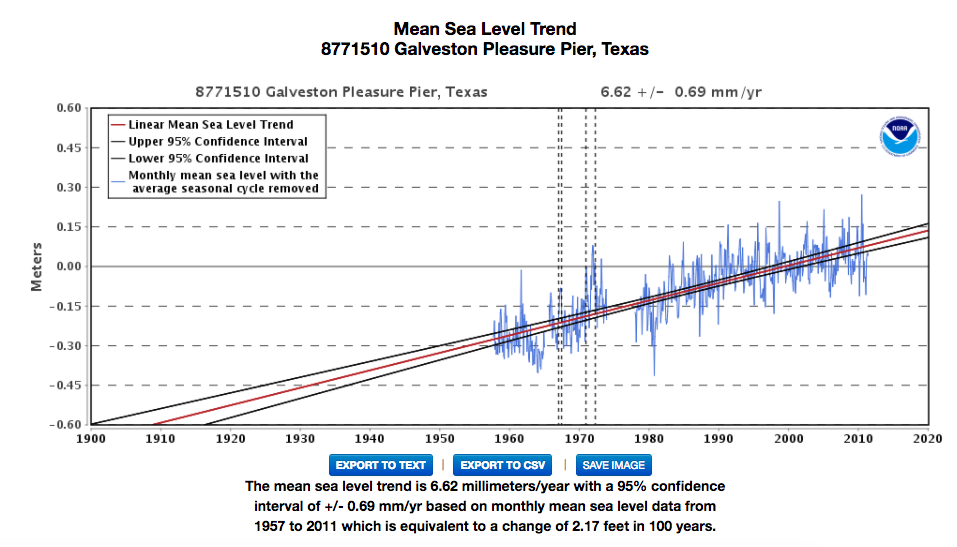 Sea levels off of Galveston, Texas, 1957-2011. Source: NOAA Tides and Currents. How we know:This information is derived from the National Oceanic and Atmospheric Administration (NOAA) study that connects global warming and hurricanes. It also draws from easy to use tools that are available online: the NOAA State Annual and Seasonal Time Series, and the NOAA Tides and Currents resource. NOAA’s GFDL study on Global Warming and Hurricanes pulls data from published articles regarding hurricane intensity and temperature fluctuations since the 1800s. NOAA’s State Annual and Seasonal Time Series is derived from the current U.S. Climate Division Database that pulls data from temperature stations. NOAA’s Tides and Currents produces sea level trends measured from U.S. and Global Stations without the regular seasonal fluctuations due to coastal ocean temperatures, salinities, winds, atmospheric pressures, and ocean currents. 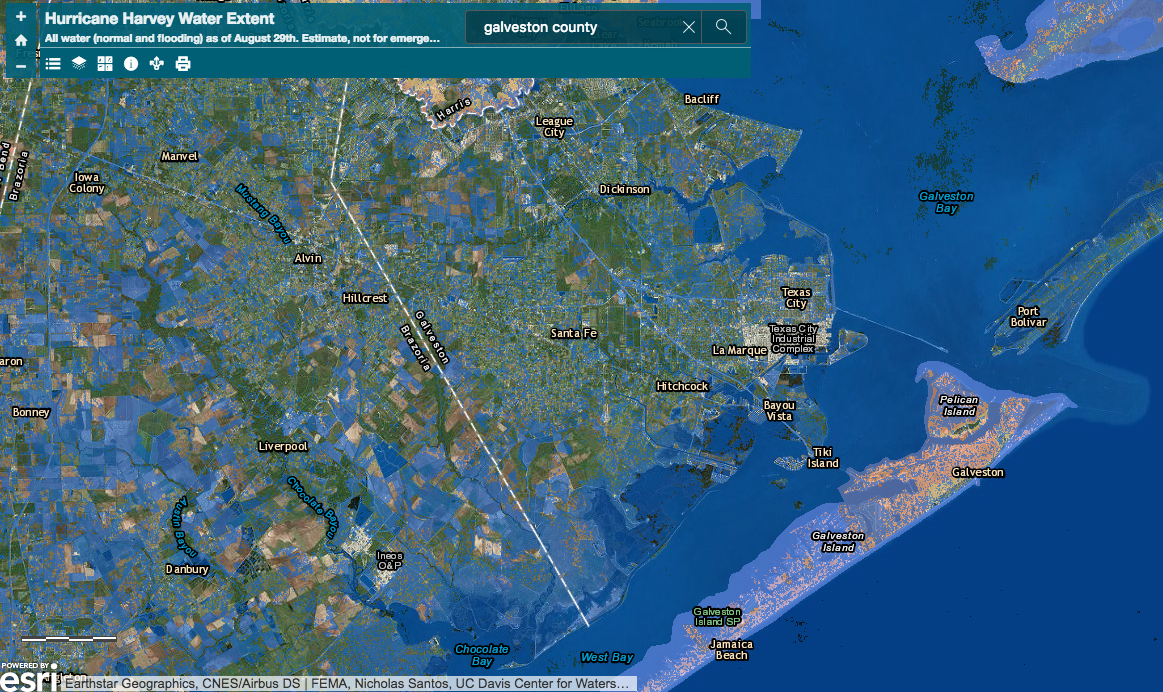 Flooding in Galveston during Hurricane Harvey. Source: UC Davis Center for Watershed Sciences Hurricane Harvey Water Extent Geographic. Human consequences:Galveston became a major U.S. commercial center and one of the largest ports in America during the 19th century. Whenever a major hurricane hits the county, its lack of a sustainable drainage system leaves many of its streets inundated with water for weeks. Without adequate flood safety measures, today 320,000 people are forced to evacuate from their homes at the approach of a hurricane. When these people are displaced and Galveston’s port is flooded, millions of dollars in goods from the commercial port are lost. Thousands of businesses around the United States that receive imported materials through this port are also impacted. Because Galveston County has long had a major commercial port, it has a great deal of infrastructure that is vulnerable to hurricanes. In 1900, it endured the deadliest natural disaster in American history, when the 15-foot storm surge of the Galveston Hurricane killed up to 12,000 people. In 1970, Hurricane Celia, a Category 4 storm, came ashore near Galveston and inflicted nearly $6 billion of damage in 2017 USD. Then, in 2017, Hurricane Harvey inflicted $23 billion worth of property damage in Harris and Galveston counties alone. Galveston County is extremely vulnerable to intense hurricanes, increasing local temperatures, and rising sea levels. As hurricanes strengthen and sea levels rise, the county may be hard pressed to survive the twenty-first century. Further reading:Article author: Kiera McCrane, Georgetown University
Article editor: Dr. Dagomar Degroot, Georgetown University 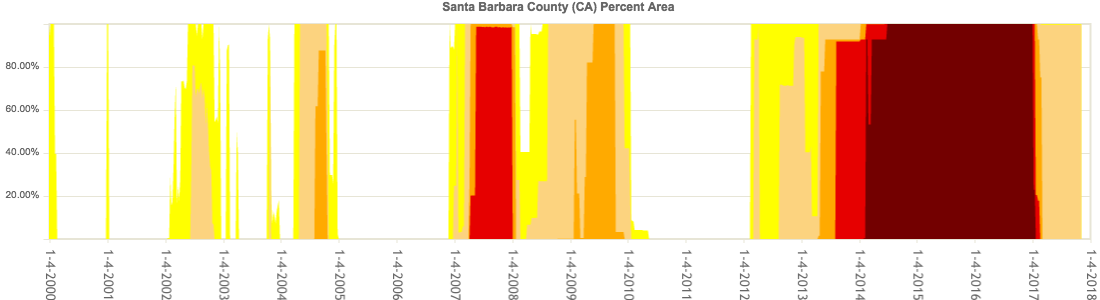 Drought severity in Santa Barbara County from 2000 until 2017, showing the landmark drought of 2014-2017. Darker colors represent worse droughts; higher values mean more of the county was in drought. Source: United States Drought Monitor. Climate changes and the local environment:Average annual temperatures across California have been rising since the nineteenth century, a trend that has sharply accelerated since around 1970. Average temperatures across all seasons in Tulare County in south central California have mirrored that statewide pattern. As the county warmed, it suffered a series of severe droughts, which are usually defined as long-lasting moisture deficits that have environmental and social consequences. Droughts in the county involve three sources of water: surface water at low elevations, snow at high elevations, and groundwater buried below the surface. Precipitation in much of California has long varied by as much as 50% from year to year. Hotter temperatures, however, are increasing the rate of evaporation across California, including in Santa Barbara County. That has affected both mountain snow and lowland liquid water, and has made local droughts even longer and drier than they once were. One of the most severe droughts in the county's history recently began in February 2012 and lasted into 2017. The driest stretch of the drought started in February 2014 and endured until January 2017. It was part of a broader Californian drought that started in coastal areas several years earlier, and was up to 27% more likely to occur in our warmer climate. Longer, drier summers and an earlier snowmelt have caused drier forest conditions in southwest California, which has increased the amount of available kindling for wildfires to consume. These conditions have increased the size and duration of wildfires in California, and dramatically lengthened the wildfire season in Santa Barbara county. How we know:These reconstructions rely on several easy to use tools that are available online: the National Oceanic and Atmospheric Administration (NOAA) State Annual and Seasonal Time Series, the NOAA Weekly Palmer Drought Indices, the National Drought Mitigation Center's United States Drought Monitor, and the United States Geological Survey (USGS) interactive website. NOAA's State Annual and Seasonal Time Series relies largely on weather station measurements. NOAA's Palmer Drought Indices use a standard way of measuring drought that considers both water supply and demand in a soil moisture model. Negative values represent droughts, and positive values represent wet conditions. The United States Drought Monitor uses a number of drought indicators, including the Palmer Drought Indices, that consider both environmental and social manifestations of water shortages. The interactive tools made available by the USGS draw on open data provided by a range of United States government agencies, including the Army Corps of Engineers and the Bureau of Reclamation. 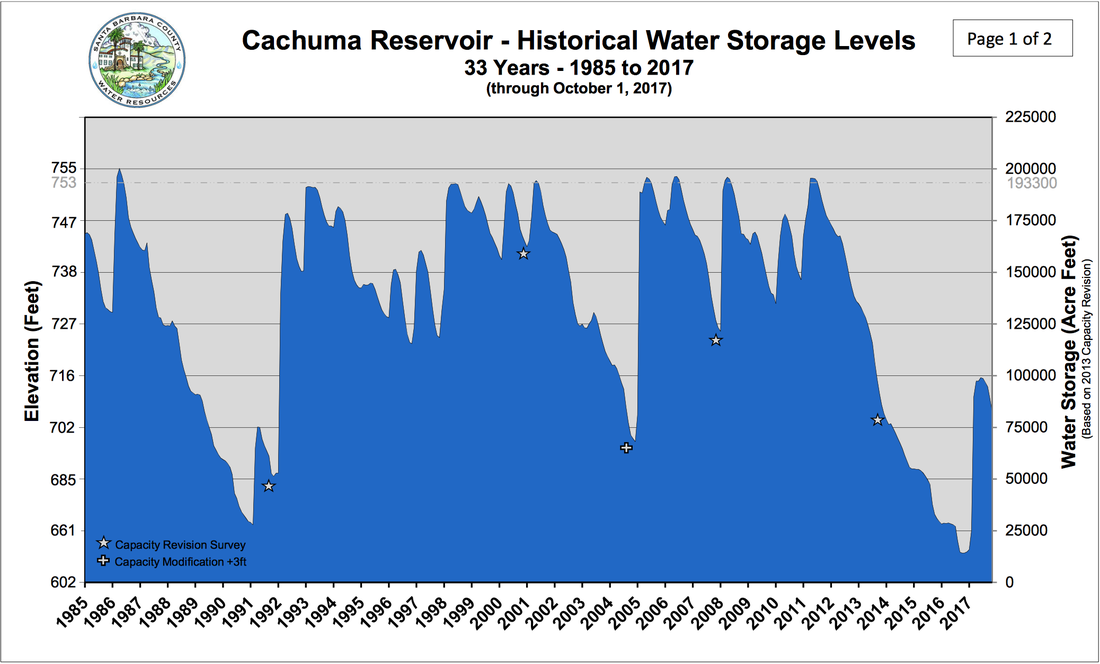 Water levels in Cachuma reservoir responded to the Californian drought. Human consequences:Droughts can sharply reduce the quantity of water in reservoirs and aquifers across California, which often supply water to local residents. Reservoirs, which collect precipitation, and aquifers, which are the groundwater storage spaces, both contribute to Santa Barbara’s water supply. This supply is crucial for both commercial and industrial use. If global warming continues, Santa Barbara’s premium wine industry could be significantly affected. This is because distinct grape species can only thrive in specific temperature ranges. If Santa Barbara fails to produce grapes that can tolerate higher temperatures, then the decline in suitable land could be up to 20%. Wine is currently the third-most produced commodity in Santa Barbara county, and wine sales comprise nearly a tenth of the county's economy. One of the main water sources that supplies residents in Santa Barbara county is the Lake Cachuma reservoir. The reservoir supplies 85 percent of the water supply for over 250,000 residents of Goleta district in Santa Barbara county. Its available water supply plummeted during the California drought. As of October 1st 2017, it is still only 43% full. The lack of water in the Cachuma reservoir, in conjunction with the drought, will force Santa Barbara county to search for alternative water sources. Just recently, the county decided to reopen its desalination plant to supply more water to their residents. The reactivation of this plant cost the county an estimated $71 million, not including the cost of maintaining the plant. It will supply 3 million gallons of water per day to residents to cover 30% of the city’s water usage. In a warmer and drier future, such desperate measures may well be necessary across California. Article author: Madeline Lee, Georgetown University
Article editor: Dr. Dagomar Degroot, Georgetown University 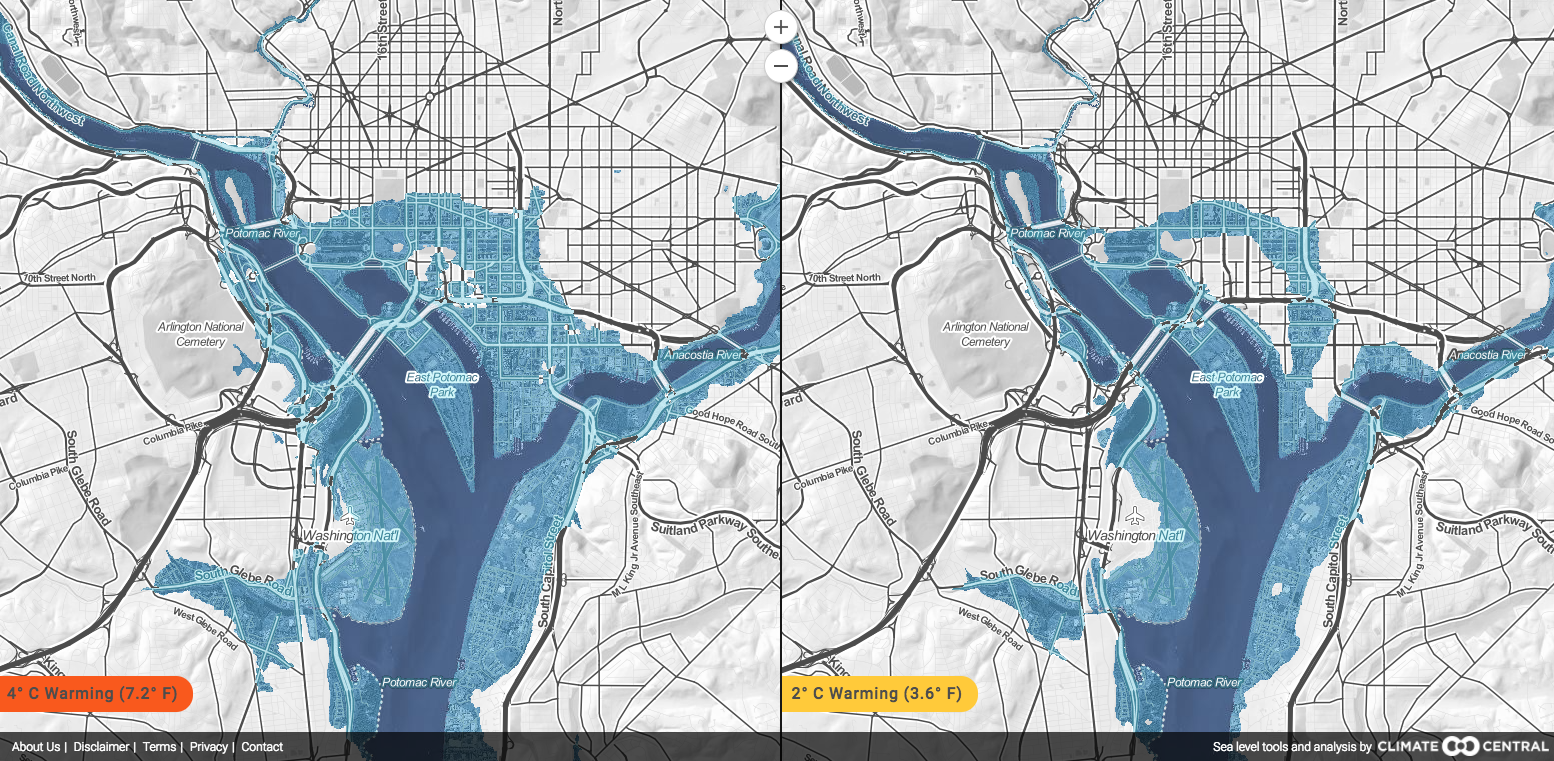 Projected sea level increases in 200-2000 years under different emissions scenarios. Climate changes and the local environment:The Paris Agreement on Climate aims to limit the increase in Earth's average temperature to 2° C, relative to pre-industrial levels. That will require dramatic cuts to human-caused greenhouse gas emissions, and in all likelihood new technology to draw carbon dioxide out of the atmosphere. Even if successful, however, these steps will still leave us with enough warming to greatly raise sea levels around the world. There are two reasons for this: first, warm liquids take up more volume than cold liquids, and second, water will flood into the oceans from ice caps on Greenland, West Antarctica, and other polar regions. Low-lying coastal regions, including much of Washington, DC, will eventually be flooded unless they are defended with extensive dikes and levees. If global temperatures rise by 4° C relative to pre-industrial averages - which they would if current long-term trends continue - then much of Washington, DC would ultimately be well below sea level. Climate projections based on continuing high greenhouse gas emissions - known as "high emissions scenarios" - predict that average water levels around Washington, DC would reach 3 feet above present levels by 2110. The city will be particularly vulnerable to flooding because it will be periodically threatened by hurricanes that could have higher sustained winds and higher storm surges than they do today. Under high emissions scenarios, there is a near certain chance by the end of the 21st century that the city will endure flooding more than 10 feet above the current high tide line. Climate projections based on continuing high greenhouse gas emissions estimate that the mean daily maximum temperature of Washington, DC will rise from roughly 20°C (68°F) to nearly 26°C (78°F) by 2100. Days with extreme heat (above 35°C, or 95°F) would increase by a factor of 9, from roughly 10 today to approximately 90 in 2100. Even if countries adhere to the Paris Agreement and sharply reduce their emissions, extreme heat days will probably still rise by a factor of 3, to roughly 30, by 2100. Precipitation patterns are unlikely to change as dramatically. 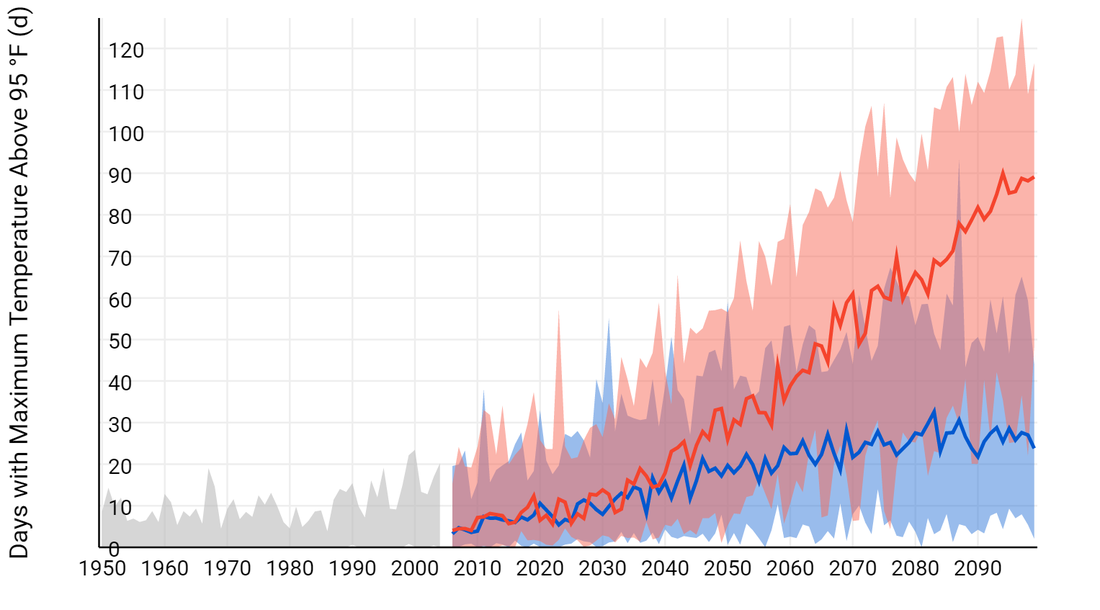 Extreme heat days, past, present, and future under high (red) and low (blue) emissions scenarios. Source: NOAA Climate Explorer. How we know:These projections primarily rely on two tools that are freely accessible online: the National Oceanic and Atmospheric Administration (NOAA) Climate Explorer app, and the Climate Central Surging Seas, Mapping Choices app. The Climate Explorer tool uses weather information recorded by meteorological instruments at weather stations to reconstruct past climate changes. It uses supercomputer simulations of future climate changes under both high and low emissions scenarios. The Surging Seas tool combines historic flood statistics and local sea level trends with global scenarios of sea level increases, which were compiled in the 2014 U.S. National Climate Assessment. Human consequences:Nearly 5,000 people live in nearly 2,000 homes on roughly 2,500 acres of land in parts of Washington that are currently under 10 feet above the high tide line. That territory is home to property worth $9 billion, and it includes 26 EPA-listed sites (including hazardous waste dumps and sewage sites). Under high emissions scenarios, all will be flooded by the year 2100. Even under low emissions scenarios, all will be permanently underwater, although that could take hundreds of years. Much of Washington, DC will eventually need to be evacuated or else protected by extensive and very expensive defenses against the sea, if these prove to be feasible. Under high emissions scenarios, extreme heat will severely tax transportation and electrical infrastructure in Washington, DC. Higher temperatures could increase the presence and transmission rate of disease, especially those that spread through mosquito vectors, such as Zika and malaria. Extreme heat days could well lead to increased mortality among the poor, sick, and elderly. The local human consequences of rising sea levels and temperatures will depend greatly on technological and social developments that are hard to foresee. Nevertheless, climate change should impact Washington, DC with particular force. Further reading:
Article author: Dr. Dagomar Degroot, Georgetown University
|
 RSS Feed