Use these tools to make your own climate data! Just remember:
- Different data come with different degrees with uncertainty. We have a very good idea of how temperature has changed in the recent past, for example, but we have a very poor understanding of how precipitation will change in the future.
- Future warming depends on two variables: the quantity of greenhouse gases released into the atmosphere by human activity, and the sensitivity of Earth's Climate System to those gases. There is still a good deal of uncertainty about both variables. Very high "emissions scenarios" - projections of how many warming gases we will release - seem increasingly unlikely (these are often lumped under the term "Representative Concentration Pathway," or RCP, 8.5). However, some new computer models suggest that the climate system might be more sensitive to greenhouse gases than previously assumed. Bear that in mind when evaluating the tools below.
- Pay close attention to what these tools are actually measuring. Estimates of eventual sea level rise under different emissions scenarios, for example, do not show what sea levels will look like when CO2 levels in Earth's atmosphere cross a certain threshold, or when the rise in Earth's temperature crosses a certain barrier (for example, two degrees Celsius above the twentieth-century average). Rather, they show what sea levels will eventually look like if warming is maintained at a certain level - possibly for centuries or millennia. Ice sheets, in this case, just take that long to melt. The reconstructions and projections you can develop using these tools, in other words, are not always self-explanatory.
National Oceanic and Atmospheric Administration (NOAA)
Climate Explorer: a very powerful app that lets you access county-by-county climate and weather data. You can create temperature and precipitation graphs from 1950 until 2100. Here's another NOAA tool with the same name that provides additional, country-wide information on climate risks.
Climate Data Online: comprehensive local, regional, and global weather data, showing both short-term weather and long-term climate trends.
Climate at a Glance: temperature and precipitation graphs available on global, regional, state, and even city and county scales, in most cases dating back to the nineteenth century.
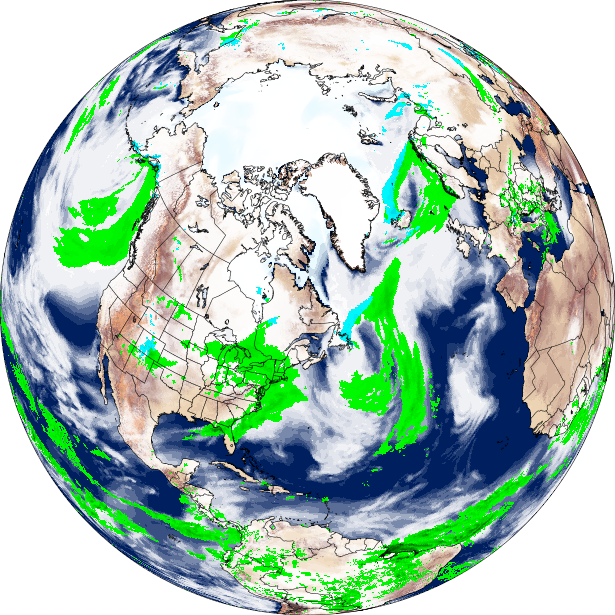
Climate Reanalyzer: regional and global hindcasts and forecasts, based on weather and climate models.
Monthly Climatic Data for the World: monthly temperature and and pressure data for cities around the world, going back to the 1940s.
Global Climate Dashboard: maps and graphs showing global and national trends in key climate indicators, dating back to the 1950s.
Sea Level Trends: a map that shows sea level changes around the world from the early twentieth century to the present.
Tropical Cyclone Climatology: lots of data on the history of tropical cyclones, including landfall records for the United States.
Paleoclimatology Data Map: plots locations covered by studies that graph past climate changes using diverse sources. A great place to learn about climate changes that predated the late nineteenth century.
Climate Data Online: comprehensive local, regional, and global weather data, showing both short-term weather and long-term climate trends.
Climate at a Glance: temperature and precipitation graphs available on global, regional, state, and even city and county scales, in most cases dating back to the nineteenth century.
Climate Reanalyzer: regional and global hindcasts and forecasts, based on weather and climate models.
Monthly Climatic Data for the World: monthly temperature and and pressure data for cities around the world, going back to the 1940s.
Global Climate Dashboard: maps and graphs showing global and national trends in key climate indicators, dating back to the 1950s.
Sea Level Trends: a map that shows sea level changes around the world from the early twentieth century to the present.
Tropical Cyclone Climatology: lots of data on the history of tropical cyclones, including landfall records for the United States.
Paleoclimatology Data Map: plots locations covered by studies that graph past climate changes using diverse sources. A great place to learn about climate changes that predated the late nineteenth century.
National Aeronautics and Space Administration (NASA)
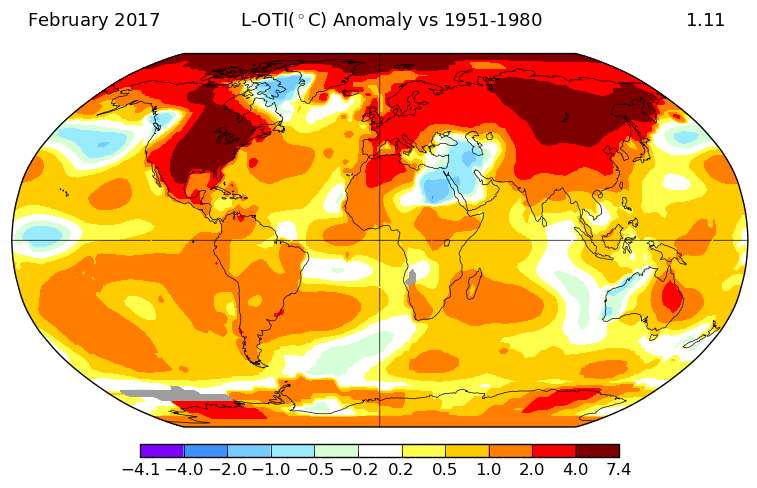
GISS Surface Temperature Analysis: maps that show departures in any given month from mean temperatures over a definable base period, going back to 1880.
Eyes on the Earth: download an app that lets you tap into NASA's satellite data to monitor environmental changes around the world as they happen.
NASA Earth Observations: browse and download over a decade of satellite data from NASA's many Earth Observing System satellites.
Earth Observatory: global maps show satellite information about everything from forest fires to atmospheric aerosols.
Climate Time Machine: big-picture overviews of major trends associated with climate change, dating back to the nineteenth century.
Scientific Visualization Studio: search NASA graphs and maps to find global, regional, and occasionally local climate data.
National Snow and Ice Data Center (NSIDC)
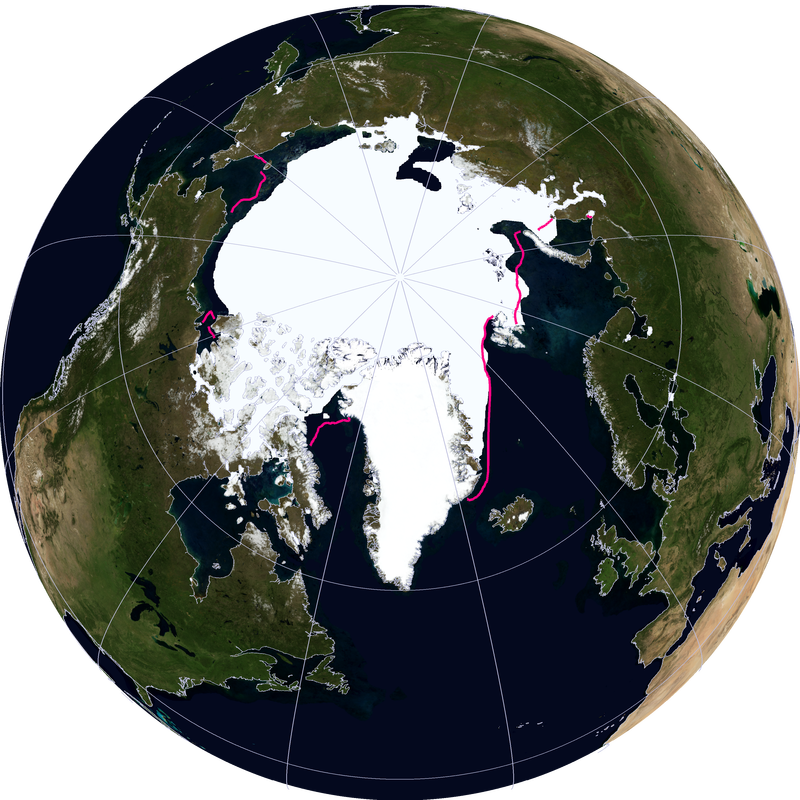
Arctic Sea Ice News and Analysis: a one-stop shop for maps and graphs relating to Arctic and Antarctic sea ice and temperature, dating back several decades.
National Drought Mitigation Center
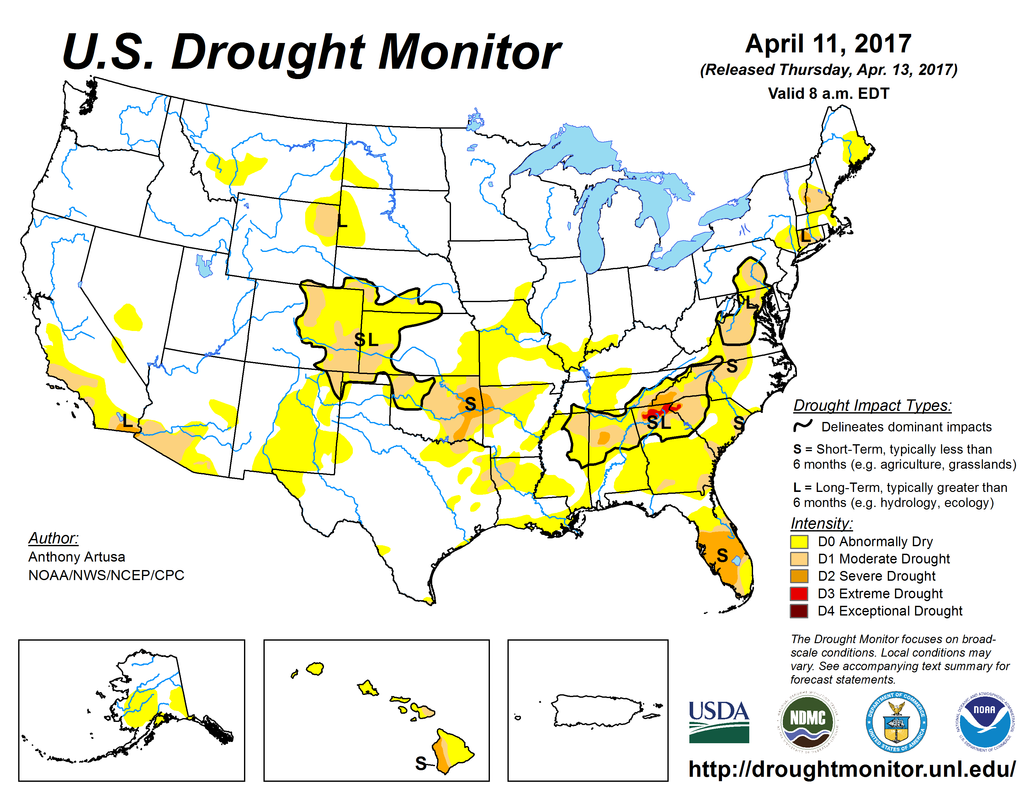
United States Drought Monitor: provides maps and graphs of current and recent droughts across the United States.
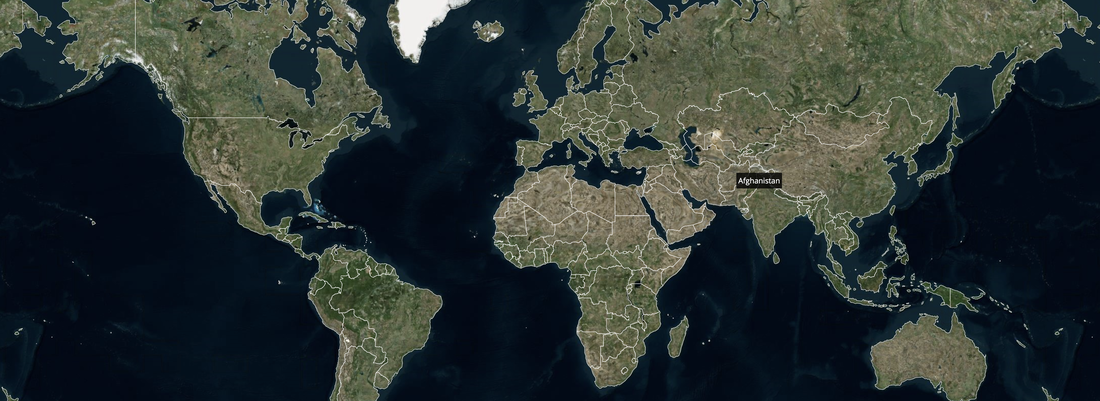
Carbon Brief
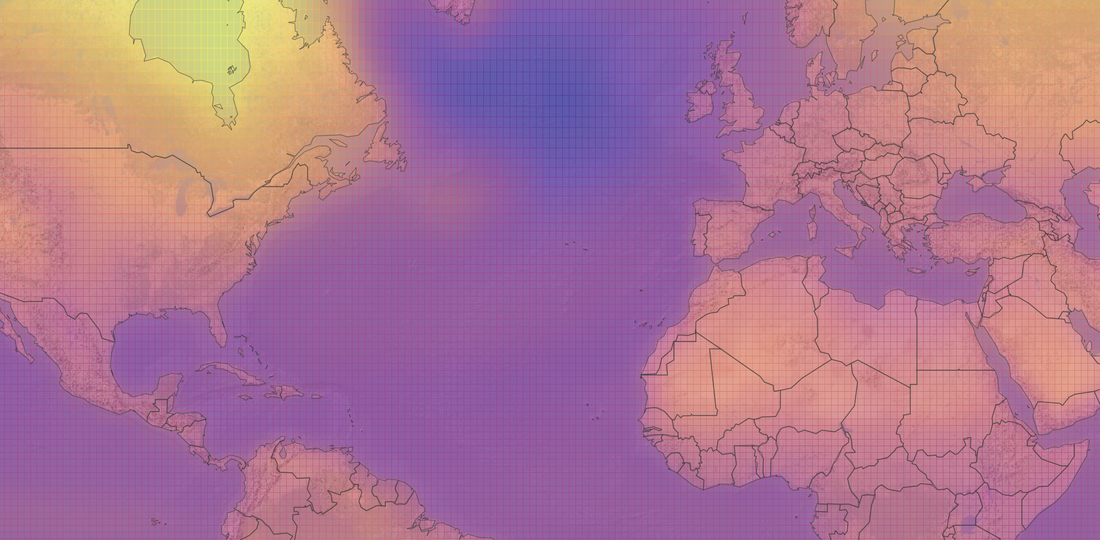
Mapped: an incredibly powerful map shows how every part of the world has warmed, and is projected to warm under different emissions scenarios. A brief description explains the map and its terminology.
Climate Central
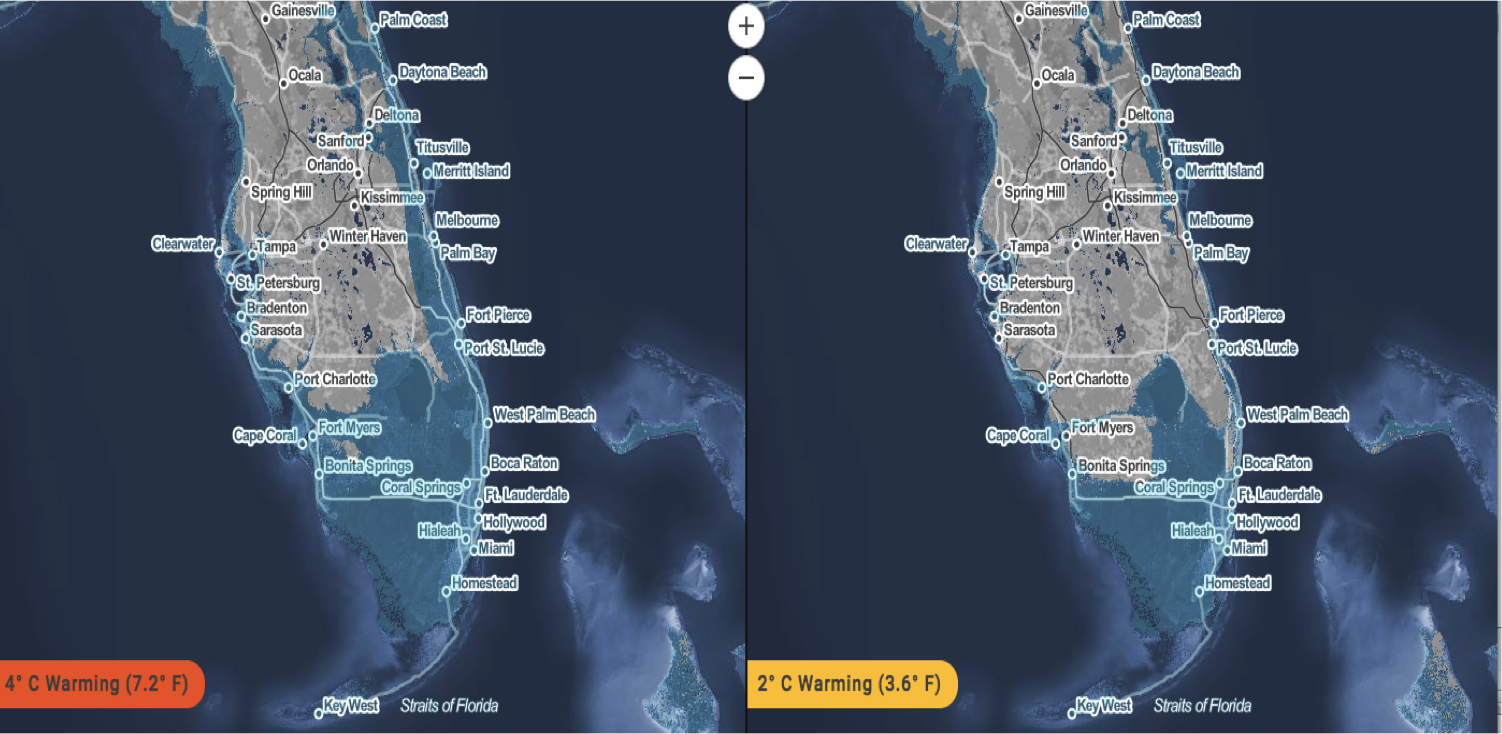
Surging Seas. Seeing Choices: accessible global, regional, and local maps that show likely sea level increases in different emissions scenarios.
World Resources Institute
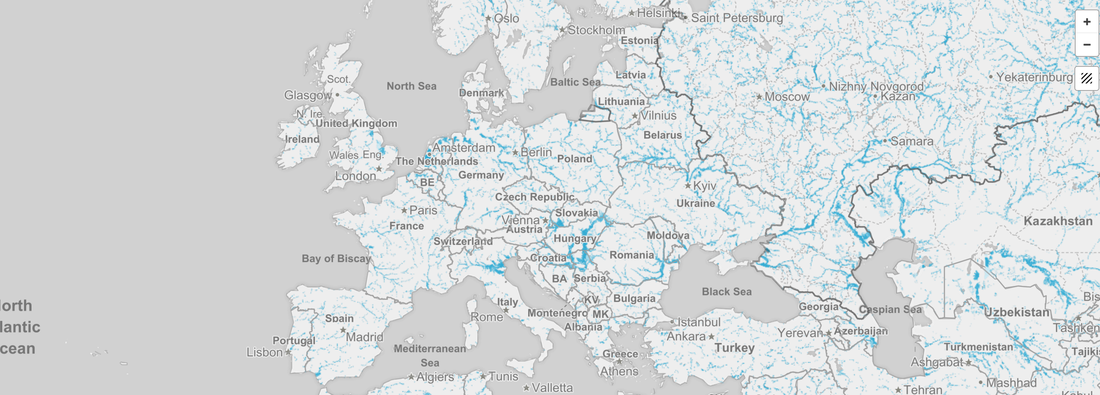
Aqueduct Global Flood Analyzer: a powerful tool that estimates the vulnerability of cities, regions, and countries to flooding, based on projected future climate change and socioeconomic development.
States at Risk
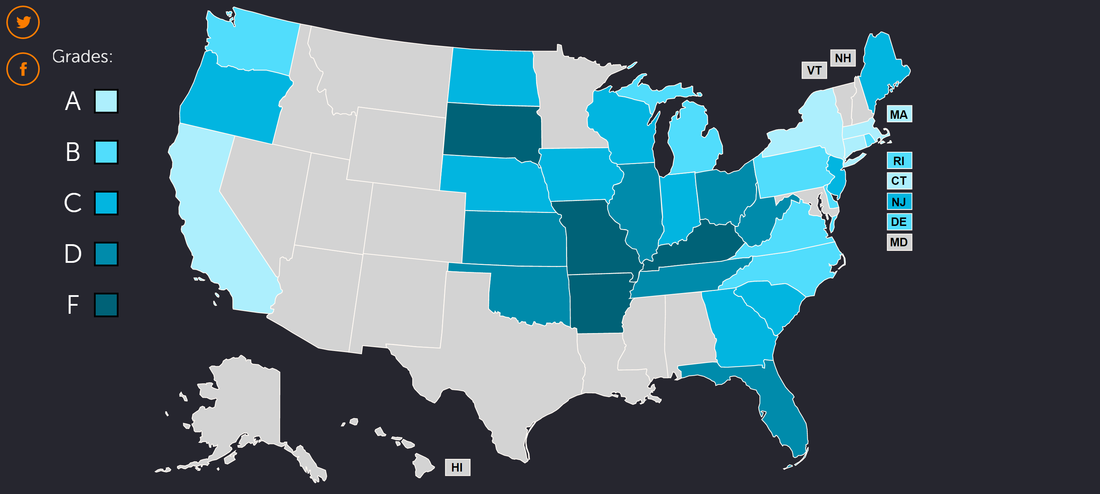
America's Preparedness Report Card: a very simple map that shows the vulnerability of every state to major environmental changes that climate change will likely set in motion.
Yale Program on Climate Change Communication
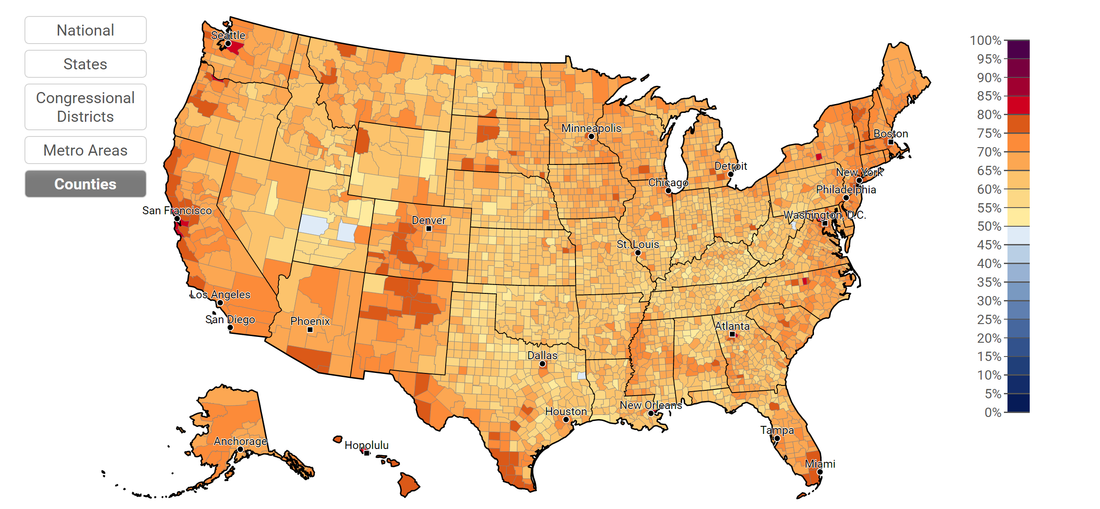
Yale Climate Opinion Maps: detailed, county-by-county maps reveal what Americans think about global warming and the threat it poses.
Environmental Protection Agency (EPA)

EJScreen Mapping Tool: one-of-a-kind visualizations of essential demographic, economic, and environmental information.
World Bank
Climate Change Knowledge Portal: one of the most comprehensive tools for global data on past and projected climate change, and its social impacts.